THStack overlay: opaque distributions

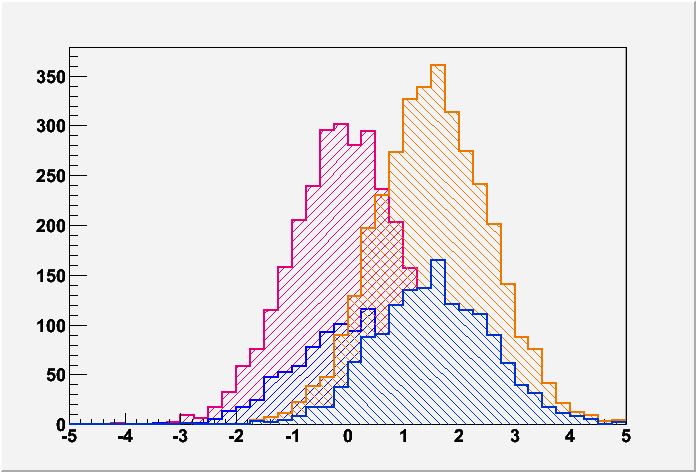
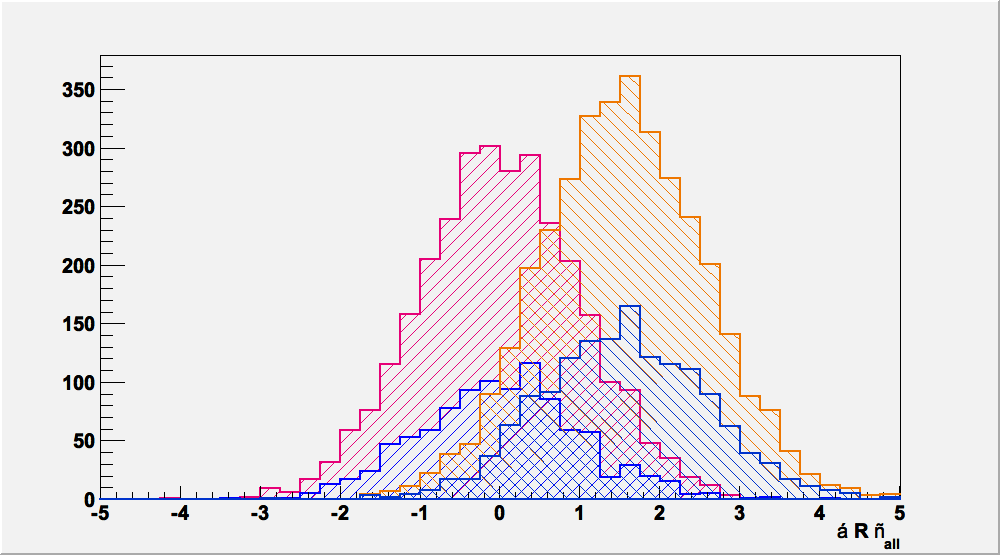
Hi, I am trying to overlay two THStack possessing 2 TH1F each. It works just fine except for a minor detail. For the THStack that gets drawn on top, the TH1F at the bottom has become opaque (but not in the sense of an opaque filling, I’ll attach an example :slight_smile: ), so that you can’t see the shape of the other THStack behind it.

Here is the operational code:

...
colorNP3p = TColor::GetColor("#e60000");
colorNP1p = TColor::GetColor("#ee7700");
colorP3p = TColor::GetColor("#009900");
colorP1p = TColor::GetColor("#0033cc");

histo_nopileup1p->SetLineColor(colorNP1p);
histo_nopileup1p->SetFillStyle(3354);
histo_nopileup1p->SetFillColor(colorNP1p);
histo_nopileup1p->SetLineWidth(4);
	  
histo_nopileup3p->SetLineColor(colorNP3p);
histo_nopileup3p->SetFillStyle(3154);
histo_nopileup3p->SetFillColor(colorNP3p);
histo_nopileup3p->SetLineWidth(4);

histo_pileup1p->SetLineColor(colorP1p);
histo_pileup1p->SetFillStyle(3345);
histo_pileup1p->SetFillColor(colorP1p);
histo_pileup1p->SetLineWidth(2);
	  
histo_pileup3p->SetLineColor(colorP3p);
histo_pileup3p->SetFillStyle(3145);
histo_pileup3p->SetFillColor(colorP3p);
histo_pileup3p->SetLineWidth(2);

THStack* hstack_nopileup = new THStack("hstacksignal", "");
THStack* hstack_pileup = new THStack("hstackpileup", "");

hstack_nopileup->Add(histo_nopileup3p);
hstack_nopileup->Add(histo_nopileup1p);
hstack_pileup->Add(histo_pileup3p);
hstack_pileup->Add(histo_pileup1p);

hstack_nopileup->Draw();
c1->Update();
hstack_nopileup->GetXaxis()->SetTitle(label[var_idx]);
hstack_nopileup->GetXaxis()->SetTitleFont(62);
hstack_nopileup->GetYaxis()->SetTitle("normalized");
hstack_nopileup->GetYaxis()->SetTitleFont(62);


hstack_pileup->Draw();
c1->Update();
hstack_pileup->GetXaxis()->SetTitle(label[var_idx]);
hstack_pileup->GetXaxis()->SetTitleFont(62);
hstack_pileup->GetYaxis()->SetTitle("normalized");
hstack_pileup->GetYaxis()->SetTitleFont(62);


// Drawing the histograms
float nopileup_max = hstack_nopileup->GetMaximum();
float pileup_max   = hstack_pileup->GetMaximum();

float yaxismax = max(pileup_max, nopileup_max);

hstack_nopileup->SetMaximum(yaxismax);
hstack_pileup->SetMaximum(yaxismax);
hstack_pileup->GetXaxis()->SetNdivisions(506);
hstack_nopileup->GetXaxis()->SetNdivisions(506);

hstack_nopileup->Draw();
hstack_pileup->Draw("SAME");
...

Have a look at the attached plot to see exactly what I mean. I would like to see the red distribution behind the green one.

The fill styles you are using should let see the histograms behind.
Do you have some little running macro reproducing this problem ?

Attached is a simplified CINT macro which reproduces the problem. It should just run out of the box.
Here is what this macro give me:


Cheers,
Michel.

THStackOverlay.C (1.89 KB)

What you see is that class “feature”. Here you are the piece of the THStack::Paint(Option_t *option) method that explains your observation. Pay your attention to the hardcoded:

h1->SetFillColor(1000); h1->SetFillStyle(1001); h1->Paint(loption);

for (Int_t i=0;i<nhists;i++) { if (strstr(lnk->GetOption(),"same")) { sprintf(loption,"%s%s",noption,lnk->GetOption()); } else { sprintf(loption,"%ssame%s",noption,lnk->GetOption()); } h1 = (TH1*)fStack->At(nhists-i-1); if (i>0) { // Erase before drawing the histogram h1col = h1->GetFillColor(); h1fill = h1->GetFillStyle(); h1->SetFillColor(1000); h1->SetFillStyle(1001); h1->Paint(loption); static TClassRef clTFrame = TClass::GetClass("TFrame",kFALSE); TAttFill *frameFill = (TAttFill*)clTFrame->DynamicCast(TAttFill::Class(),gPad->GetFrame()); h1->SetFillColor(frameFill->GetFillColor()); h1->SetFillStyle(frameFill->GetFillStyle()); h1->Paint(loption); h1->SetFillColor(h1col); h1->SetFillStyle(h1fill); } h1->Paint(loption); lnk = (TObjOptLink*)lnk->Prev(); } I slightly changed your macro (see attachment) and re-run it with the QtRoot plugin (see the thread Transparent histogram fill style for some details)


THStackOverlay.hash.C (2.09 KB)
THStackOverlay.4.QtRoot.C (2.04 KB)

Thanks a lot!
This should do just fine.

I’ve editted my reply to add the second version. It is more close to your original design (see above)

QtRoot plugin provides one extra file format to save TCanvas/TPad images. It is so-called “Web Page” format. It is to allow the user to generate the clickable Web page root.bnl.gov/QtRoot/pictures/THStackOverlay automatically

I am installing QtROOT right now. It appears that Qt4 is not installed by default on MacOS X, so I am installing it using MacPorts, and it takes quite a while to build… In any case, I just figured out the logic behind this THStack behavior that I am trying to circumvent, and thought I would post it here.

It appears that every time a new histogram is added to a THStack, what is actually stored is not only the histogram itself but the sum of this new histogram with the previous histograms stored. Once the THStack is drawn, here is what it actually does. Let’s say there are 3 histograms in the stack:

Draw histo1 + histo2 + histo3,
Draw histo2 + histo3, make opaque,
Draw histo3, make opaque.

It makes the histograms on the bottom opaque just to provide the illusion that histo1 is on top of histo2, and that histo2 is on top of histo3. So, if I make histo2 and histo3 transparent, I should see the filling of histo1 through histo 2 and histo3, and I should also see the filling of histo2 behind histo3.

Hi,

I managed to install QtROOT, and the macro that you have provided works just fine when I run it without alterations. I applied the necessary changes to the macro in which I encountered the problem in the first place, and it just goes the way it usually goes: when you solve a problem, you create another!

So when I output a pdf file, this is what I get:
AvgRadius7TeVIntegratedPvsNPsignal.pdf (20.2 KB)

And when I output a png file, I get this:


In the pdf file, I don’t get the transparency, but I get the right latex characters. The label on the x axis is coded as:

#LT R #GT_{all}

In the png file, I get the transparency, but the label is wrong, and the fill lines are a bit too thick to my taste.

In both case, I loose control over the size of the canvas, which I create using

TCanvas *c1 = new TCanvas("c1", "c1", 50,50,800,600);

Is is possible to regain control on any of this? Ideally, I would like to output .pdf and .eps files since these plots are ultimately for an ATLAS Note as well as my thesis, but if it is only possible to get .png it will be fine.

I attached the full macro that I am using, but it probably won’t run since it requires 4 input root files. I could provide small versions of these input files if necessary.

Integrated.C (15 KB)

Thanks a lot for the help so far.

In fact all this cannot work because the code of THStack::Paint(Option_t *option) there is a section called (have a look at the code):

// Erase before drawing the histogram

which does what you are complaining about. It means that the behavior you get is done on purpose. Qt or not Qt the PDF file will not work as you want. The QT recipe is just a trick. We can imagine to add an option

#LT R #GT_{all}

I can not reproduce this yet. I added your LaTeX to ROOT hsimple.C and got the correct image


[quote=“emitc2h”]. . . .In both case, I loose control over the size of the canvas, which I create using TCanvas *c1 = new TCanvas("c1", "c1", 50,50,800,600);[/quote]. I could not reproduce that yet. It works for me.[quote=“emitc2h”]… I would like to output .pdf and .eps files [/quote]Did you try convert my.png my.pdf ? Is it sufficient? It is not the full-fledged vectorized format of course . However, it may be Ok for your immediate needs. [quote=“emitc2h”] . . . but it probably won’t run since it requires 4 input root files. I could provide small versions of these input files if necessary.[/quote]. Please, upload it somewhere (afs/web). It will help. I’ll fix it and send you back.

Hi,

Here is a link to a reduced statistics data set:http://hep.phys.sfu.ca/~michel/data.tar.

I just realize that there is an extra thing that may cause discrepancies. I am actually applying the AtlasStyle.C macro implicitly, using the .rootrc file. What you get from my Integrated.C macro might differ in style because of this, but when I try to remove the AtlasStyle, the label and the canvas size problems I mentioned persist, and weirdly, the THStack bottom histograms are not transparent anymore.

There are a few things I should mention about this macro. It is actually making plots for several variables at once, and the histogram settings are stored in std::vectors. If you want to produce a single plot, AvgRadius (which is the one I showed), you can just comment out where the settings for the other variables are being pushed back. Also, there is a bool in the “Controls” section at the beginning of the macro that selects whether the pileup/ no pileup comparison is done on signal or background. It should be set on signal, as I have no need of separating background in 1p and 3p sub-populations.

The path to the input files are also at the beginning of the macro, and should be adjusted accordingly.

Thank you so much for looking into this.

[quote=“emitc2h”]… and weirdly, the THStack bottom histograms are not transparent anymore.
[/quote]Very likely you turned the Qt-plugin off with your “.rootrc”.

I just realized that I can just overlay the TH1F of the 3p distribution with the TH1F of the 1p+3p distribution to achieve what I desire, don’t spend much time on this unless you really really want to!

Cheers.

Your macro doesn’t work for me

Processing Integrated.C... Error in <TROOT::LoadMacro>: macro AtlasUtils.C not found in

[rcas6002] ~/scratch2/expert/RootForum/> grep -n myText *.C Integrated.C:574: myText( x1+0.01, y1-0.05, 1,"7 TeV Simulation"); Integrated.C:577: myText( x1+0.01, y1-0.1, 1,"Signal"); Integrated.C:579: myText( x1+0.01, y1-0.11, 1,"Background"); *** Interpreter error recovered *** However, the X-axis label is correct. and the TCanvas size is correct also.

[quote=“emitc2h”]and the fill lines are a bit too thick to my taste.[/quote]Your macro defines it as

gStyle->SetHatchesLineWidth(2); Did you try to apply gStyle->SetHatchesLineWidth(1);instead?[quote=“emitc2h”]It is actually making plots for several variables at once, and the histogram settings are stored in std::vectors. If you want to produce a single plot . . . [/quote]Excuse me, I do not want to produce any plot. I need a smallest macro reproducing your issue. Your current example is 600 lines of the code. Can you reproduce your problem with 30-40 lines macro instead?

Ah I see. The reason the macro does not work for you is simply because of the absence of AtlasUtils.C.
Here is the file:
AtlasUtils.C (7.46 KB)

It must simply be that qtRoot interprets thickness slightly differently then. This thickness of 2 is perfectly fine when I use the native GUI Backend.

I’ll try to reproduce the two remaining issues (the label and the canvas size thing) in the THStackOverlay macro we have been playing with.

Well, I could reproduce the label bug, but not the Canvas bug, which is fine. If it works in this macro, I am probably just doing something silly.

Here is what I get:


And here is the macro:

THStackOverlay.label.C (2.44 KB)

I only modified a few lines at the end (with respect to THStackOverlay.hash.C) in order to set the axis title.

Interesting . . . .What country are your working from? I mean what is your default code page. Is it “French”. Can you reproduce the “label” issue with the “USA” localization?
Can you replace hstackA->GetXaxis()->SetTitle("#LT R #GT_{all}");with

hstackA->GetXaxis()->SetTitle("< R > _{all}");.