Date: Fri, 26 May 2006 21:08:22 +0200
Hi,
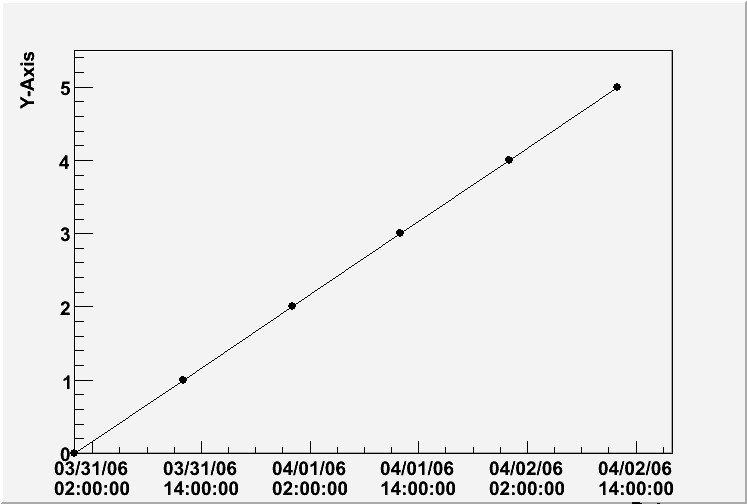
I don't see the problem with cvs head version of Root on Windows XP (see the saved (gif) canvas in attachment).
Cheers,
Bertrand.
Rene Brun wrote:
> Hi Joel,
>
> I cannot reproduce your problem on Linux and macosx.
> Olivier will investigate what happens on Windows as soon as he will be
> back on Monday.
>
> Rene Brun
>
>
> On Thu, 25 May 2006, Flanders, Joel M. (JSC-SF2)[LM] wrote:
>
>> I am using windows xp and ROOT version 5.11/02. I ran the following
>> macro:
>>
>> {
>> TDatime CurrentDate(2006,03,31,00,00,00);
>> TGraph *gr7 = new TGraph();
>> gr7->SetPoint(0,0,0);
>> gr7->SetPoint(1,43200,1);
>> gr7->SetPoint(2,86400,2);
>> gr7->SetPoint(3,129600,3);
>> gr7->SetPoint(4,172800,4);
>> gr7->SetPoint(5,216000,5);
>> gr7->GetXaxis()->SetTimeOffset(CurrentDate.Convert(),"local");
>> gr7->GetXaxis()->SetTitle("Date");
>> gr7->GetXaxis()->SetTimeDisplay(1);
>> gr7->GetXaxis()->SetTimeFormat("#splitline{%m\/%d\/%y}{%H\:%M\:%S}");
>> gr7->GetXaxis()->SetLabelOffset(0.03);
>> gr7->GetXaxis()->SetNdivisions(508);
>> gr7->GetXaxis()->SetTitleOffset(1.7);
>> gr7->GetYaxis()->SetTitle("Y-Axis");
>> gr7->SetMarkerStyle(20);
>> gr7->Draw("ALP");
>> }
>>
>> I get a canvas with a time axis plot. The problem is for the first 2
>> days major axis divisions come every 12 hours, but during the transition
>> from day 2 to day 3 the first major division on day 3 comes 13 hours
>> after the last one on day 2. After this it goes back to 12 hours between
>> major divisions. However this causes the endpoint of the data to be 1
>> hour ahead of where it should be. Am I doing something wrong here to
>> cause this issue?
>>
>> I had a colleague who uses Linux (CentOS) test this on his workstation,
>> and he gets the same error.
>>
>> Thanks,
>> Joel Flanders
>>
>
