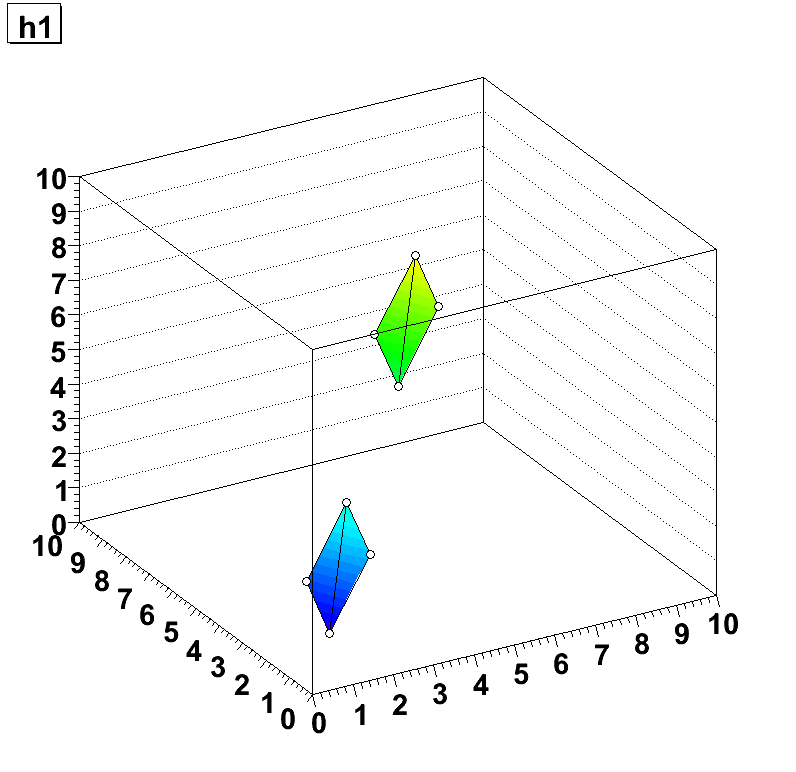
Date: Mon, 5 Nov 2007 11:58:41 +0100
Hi,
The following macro does it. It produces the attached picture. But writing this example I found (on my machine) some problem when quitting root after having executed this macro. I am looking at it now.
void graph2dsame2()
{
gStyle->SetOptStat(0);
gStyle->SetOptFit(1111);
TCanvas *c = new TCanvas("c","Graph2D example",0,0,800,800);
TH2F *h1 = new TH2F("h1","h1",10,0,10,10,0,10);
h1->SetMinimum(0);
h1->SetMaximum(10);
   Double_t x1[4] = {1,1,2,2};
   Double_t y1[4] = {1,2,1,2};
   Double_t z1[4] = {1,2,3,4};
TGraph2D *g2d1 = new TGraph2D(4,x1,y1,z1);
g2d1->SetHistogram(h1);
g2d1->Draw("P0 TRI1");
TH2F *h2 = new TH2F("h2","h2",10,0,10,10,0,10);
h2->SetMinimum(0);
h2->SetMaximum(10);
   Double_t x2[4] = {5,5,6,6};
   Double_t y2[4] = {5,6,5,6};
   Double_t z2[4] = {5,6,7,8};
TGraph2D *g2d2 = new TGraph2D(4,x2,y2,z2);
g2d2->SetHistogram(h2);
g2d2->Draw("P0 TRI1 SAME");
}
-----Original Message-----
From: owner-roottalk_at_root.cern.ch [mailto:owner-roottalk_at_root.cern.ch]
On Behalf Of Vassili Maroussov
Sent: Friday, November 02, 2007 10:00 PM
To: roottalk (Mailing list discussing all aspects of the ROOT system)
Subject: [ROOT] TMultiGraph2D?
Dear ROOTers,
I have two functions, z_1(x,y), z_2(x,y) (= two (x,y,z) datasets), each
is defined in its own, yet rectangular (x,y) area; areas don't overlap and their dimensions differ. I'm wondering whether there is any possibility to plot them in a common axis box in such a way that each dataset is plotted only where it is defined (no mesh and whatever in "empty" (x,y) area; the definition areas are clearly visible).
Regards,
Vassili
