
New class TScatter
(30 May 2023)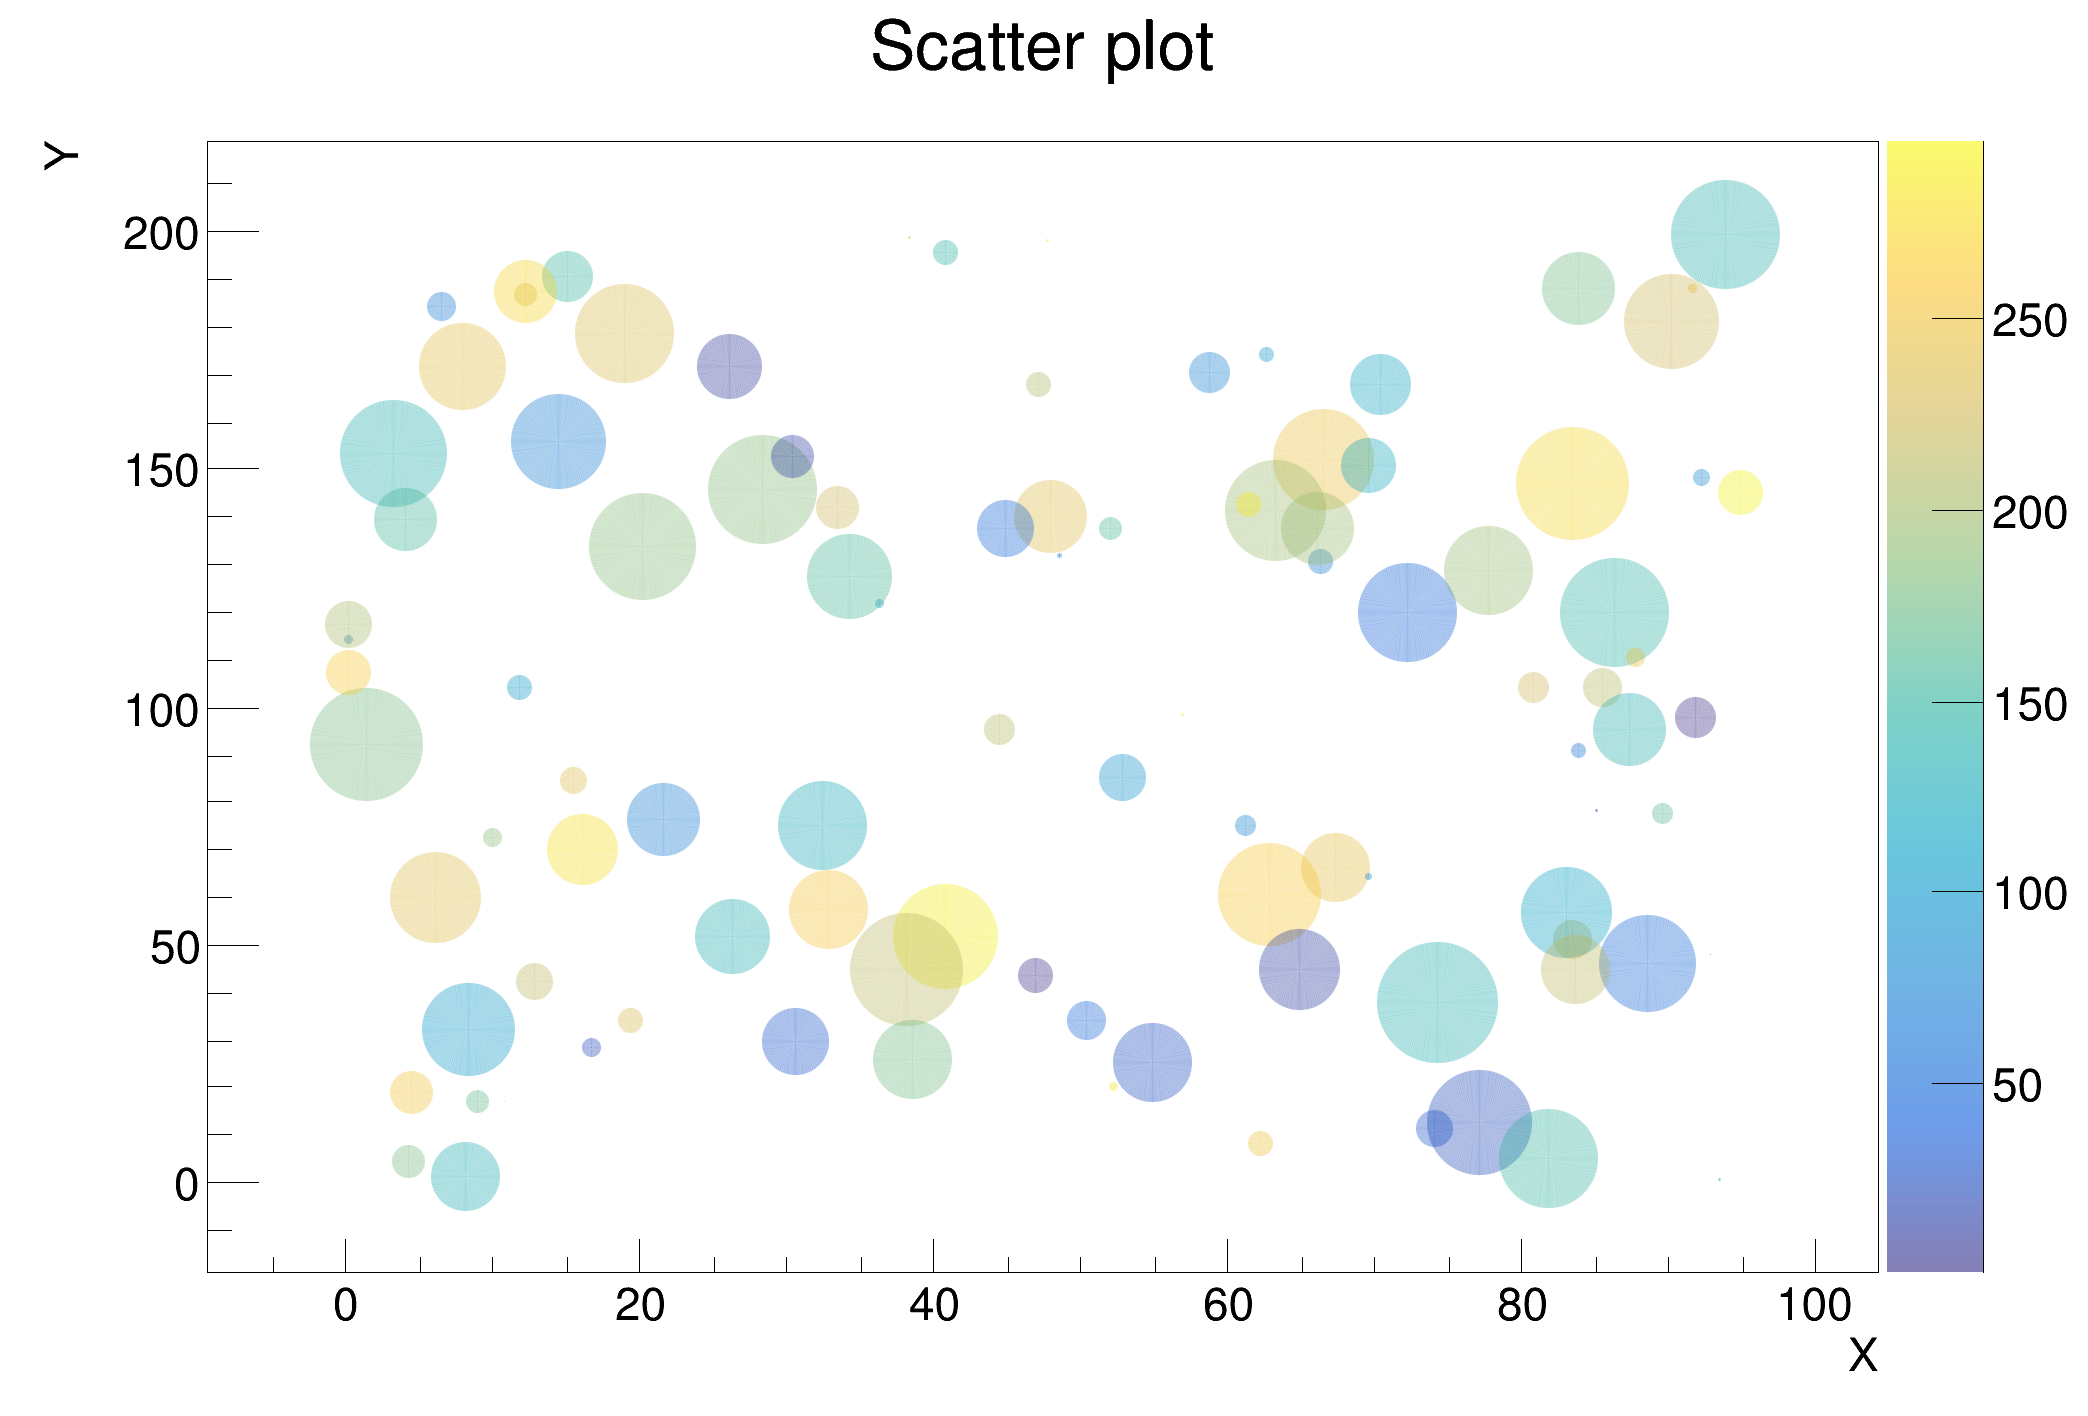
2D Scatter plots are a very popular way to represent scientific data. Many scientific plotting packages have this functionality. For many years ROOT itself as offered this kind of visualization via:
- The option
Pto draw TGraph: A marker is drawn at each point positions but all markers will have the same size and the same color. - The
COLoption ofTTree::Draw():tree.Draw("e1:e2:e3","","col")produces a 2D scatter plot withe1vse2, and e3 is mapped on the current color palette. That’s a bit better as it allows to draw three variables on a 2D plot. But one needs to create aTTreeor aTNtuplewhich is a bit heavy when the data are already stored in simple vectors.
Therefore there was a need for a new class able to produce, in a simple way, this famous multi-variables way to visualize data.
In order to full-fill these requirements a new class, TScatter, has been
implemented. It is able to draw a four variables scatter plot on a single plot. The first two variables
are the x and y coordinates of the markers, the third one is mapped on the current color map, and
the fourth one on the marker size.
Note that it is recommended to use a transparent color map as markers will, most of the time, overlap.
The code to produce a scatter plot with the new class TScatter is as simple as:
void scatter()
{
   auto canvas = new TCanvas();
   gStyle->SetPalette(kBird, 0, 0.6); // define a transparent palette

   const int n = 100;
   double x[n];
   double y[n];
   double c[n];
   double s[n];

   // Define four random data set
   auto r  = new TRandom();
   for (int i=0; i<n; i++) {
      x[i] = 100*r->Rndm(i);
      y[i] = 200*r->Rndm(i);
      c[i] = 300*r->Rndm(i);
      s[i] = 400*r->Rndm(i);
   }

   auto scatter = new TScatter(n, x, y, c, s);
   scatter->SetMarkerStyle(20);
   scatter->SetMarkerColor(kRed);
   scatter->SetTitle("Scatter plot;X;Y");
   scatter->Draw("A");
}