Loading [MathJax]/extensions/tex2jax.js
Logo ROOT   6.08/07
Reference Guide
All Classes Namespaces Files Functions Variables Typedefs Enumerations Enumerator Properties Friends Macros Modules Pages
multipalette.C File Reference

Detailed Description

View in nbviewer Open in SWAN Draw color plots using different color palettes.

pict1_multipalette.C.png
#include "TStyle.h"
#include "TColor.h"
#include "TF2.h"
#include "TExec.h"
#include "TCanvas.h"
void Pal1()
{
static Int_t colors[50];
static Bool_t initialized = kFALSE;
Double_t Red[3] = { 1.00, 0.00, 0.00};
Double_t Green[3] = { 0.00, 1.00, 0.00};
Double_t Blue[3] = { 1.00, 0.00, 1.00};
Double_t Length[3] = { 0.00, 0.50, 1.00 };
if(!initialized){
Int_t FI = TColor::CreateGradientColorTable(3,Length,Red,Green,Blue,50);
for (int i=0; i<50; i++) colors[i] = FI+i;
initialized = kTRUE;
return;
}
gStyle->SetPalette(50,colors);
}
void Pal2()
{
static Int_t colors[50];
static Bool_t initialized = kFALSE;
Double_t Red[3] = { 1.00, 0.50, 0.00};
Double_t Green[3] = { 0.50, 0.00, 1.00};
Double_t Blue[3] = { 1.00, 0.00, 0.50};
Double_t Length[3] = { 0.00, 0.50, 1.00 };
if(!initialized){
Int_t FI = TColor::CreateGradientColorTable(3,Length,Red,Green,Blue,50);
for (int i=0; i<50; i++) colors[i] = FI+i;
initialized = kTRUE;
return;
}
gStyle->SetPalette(50,colors);
}
TCanvas *multipalette() {
TCanvas *c3 = new TCanvas("c3","C3",0,0,600,400);
c3->Divide(2,1);
TF2 *f3 = new TF2("f3","0.1+(1-(x-2)*(x-2))*(1-(y-2)*(y-2))",1,3,1,3);
f3->SetLineWidth(1);
c3->cd(1);
f3->Draw("surf1");
TExec *ex1 = new TExec("ex1","Pal1();");
ex1->Draw();
f3->Draw("surf1 same");
c3->cd(2);
f3->Draw("surf1");
TExec *ex2 = new TExec("ex2","Pal2();");
ex2->Draw();
f3->Draw("surf1 same");
return c3;
}
Author
Olivier Couet

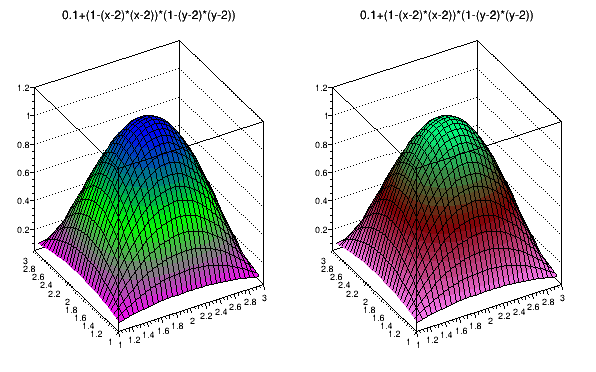
Definition in file multipalette.C.