When moving the mouse in the canvas, a second canvas shows the projection along X of the bin corresponding to the Y position of the mouse. The resulting histogram is fitted with a gaussian. A "dynamic" line shows the current bin position in Y. This more elaborated example can be used as a starting point to develop more powerful interactive applications exploiting CINT as a development engine.
Note that a class is used to hold on to the canvas that display the selected slice.
import sys
from ROOT import gRandom, gPad, gROOT, gVirtualX
from ROOT import kTRUE, kRed
from ROOT import TCanvas, TH2, TH2F, Double
class DynamicExec:
def __init__( self ):
self._cX = None
self._cY = None
self._old = None
def __call__( self ):
h = gPad.GetSelected();
if not h:
return
if not isinstance( h, TH2 ):
return
gPad.GetCanvas().FeedbackMode( kTRUE )
px = gPad.GetEventX()
py = gPad.GetEventY()
uxmin, uxmax = gPad.GetUxmin(), gPad.GetUxmax()
uymin, uymax = gPad.GetUymin(), gPad.GetUymax()
pxmin, pxmax = gPad.XtoAbsPixel( uxmin ), gPad.XtoAbsPixel( uxmax )
pymin, pymax = gPad.YtoAbsPixel( uymin ), gPad.YtoAbsPixel( uymax )
if self._old != None:
gVirtualX.DrawLine( pxmin, self._old[1], pxmax, self._old[1] )
gVirtualX.DrawLine( self._old[0], pymin, self._old[0], pymax )
gVirtualX.DrawLine( pxmin, py, pxmax, py )
gVirtualX.DrawLine( px, pymin, px, pymax )
self._old = px, py
upx = gPad.AbsPixeltoX( px )
x = gPad.PadtoX( upx )
upy = gPad.AbsPixeltoY( py )
y = gPad.PadtoY( upy )
padsav = gPad
if not self._cX:
self._cX =
TCanvas(
'c2',
'Projection Canvas in X', 730, 10, 700, 500 )
else:
self._DestroyPrimitive( 'X' )
if not self._cY:
self._cY =
TCanvas(
'c3',
'Projection Canvas in Y', 10, 550, 700, 500 )
else:
self._DestroyPrimitive( 'Y' )
self.DrawSlice( h, y, 'Y' )
self.DrawSlice( h, x, 'X' )
padsav.cd()
def _DestroyPrimitive( self, xy ):
proj = getattr( self, '_c'+xy ).GetPrimitive( 'Projection '+xy )
if proj:
proj.IsA().Destructor( proj )
def DrawSlice( self, histo, value, xy ):
yx = xy == 'X' and 'Y' or 'X'
canvas = getattr( self, '_c'+xy )
canvas.SetGrid()
canvas.cd()
bin = getattr( histo, 'Get%saxis' % xy )().FindBin( value )
hp = getattr( histo, 'Projection' + yx )( '', bin, bin )
hp.SetFillColor( 38 )
hp.SetName( 'Projection ' + xy )
hp.SetTitle( xy + 'Projection of bin=%d' % bin )
hp.Fit( 'gaus', 'ql' )
canvas.Update()
if __name__ == '__main__':
c1 =
TCanvas(
'c1',
'Dynamic Slice Example', 10, 10, 700, 500 )
c1.SetFillColor( 42 )
c1.SetFrameFillColor( 33 )
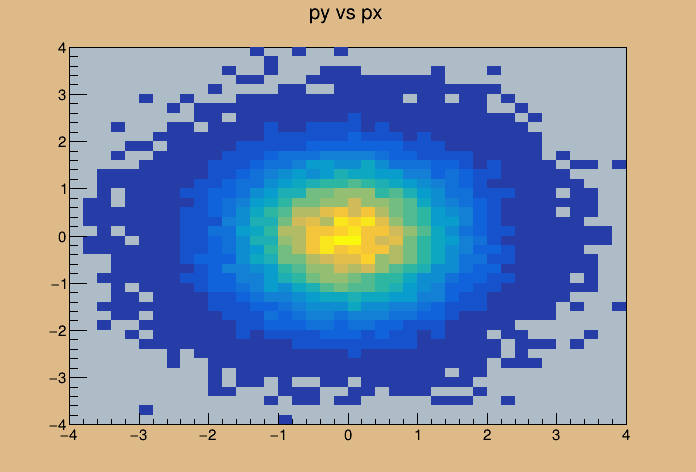
hpxpy =
TH2F(
'hpxpy',
'py vs px', 40, -4, 4, 40, -4, 4 )
hpxpy.SetStats( 0 )
for i in range( 50000 ):
gRandom.Rannor( x, y )
hpxpy.Fill( x, y )
hpxpy.Draw( 'COL' )
import __main__
__main__.slicer = DynamicExec()
c1.AddExec( 'dynamic', 'TPython::Exec( "slicer()" );' )
c1.Update()


 ROOT 6.10/09 - Reference Guide Generated on Thu May 31 2018 12:11:41 using Doxygen 1.8.13.