Logo ROOT   6.10/09
Reference Guide
exclusiongraph.C File Reference

Detailed Description

View in nbviewer Open in SWAN Draw three graphs with an exclusion zone.

pict1_exclusiongraph.C.png
TCanvas *exclusiongraph() {
TCanvas *c1 = new TCanvas("c1","Exclusion graphs examples",200,10,600,400);
c1->SetGrid();
TMultiGraph *mg = new TMultiGraph();
mg->SetTitle("Exclusion graphs");
const Int_t n = 35;
Double_t xvalues1[n], xvalues2[n], xvalues3[n], yvalues1[n], yvalues2[n], yvalues3[n];
for (Int_t i=0;i<n;i++) {
xvalues1[i] = i*0.1;
xvalues2[i] = xvalues1[i];
xvalues3[i] = xvalues1[i]+.5;
yvalues1[i] = 10*sin(xvalues1[i]);
yvalues2[i] = 10*cos(xvalues1[i]);
yvalues3[i] = 10*sin(xvalues1[i])-2;
}
TGraph *gr1 = new TGraph(n,xvalues1,yvalues1);
gr1->SetLineColor(2);
gr1->SetLineWidth(1504);
gr1->SetFillStyle(3005);
TGraph *gr2 = new TGraph(n,xvalues2,yvalues2);
gr2->SetLineColor(4);
gr2->SetLineWidth(-2002);
gr2->SetFillStyle(3004);
gr2->SetFillColor(9);
TGraph *gr3 = new TGraph(n,xvalues3,yvalues3);
gr3->SetLineColor(5);
gr3->SetLineWidth(-802);
gr3->SetFillStyle(3002);
gr3->SetFillColor(2);
mg->Add(gr1);
mg->Add(gr2);
mg->Add(gr3);
mg->Draw("AC");
return c1;
}
Author
Olivier Couet

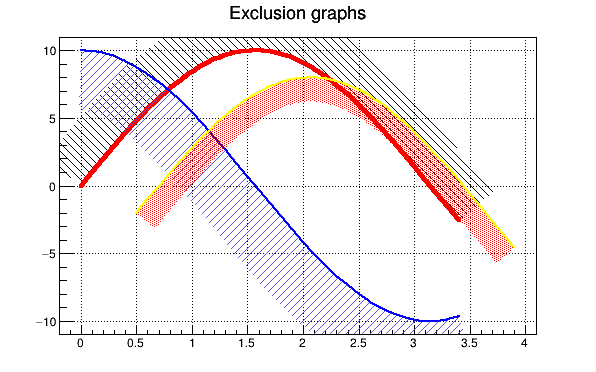
Definition in file exclusiongraph.C.