
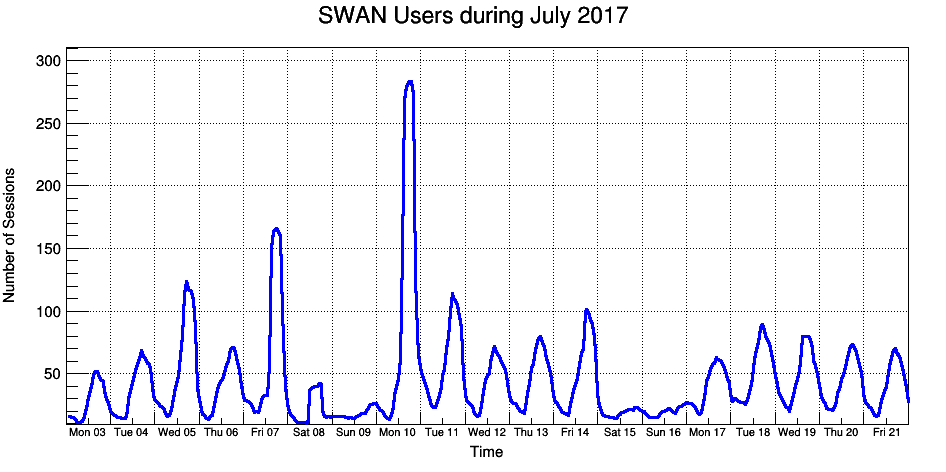
 This macro illustrates the use of the time axis on a TGraph with data read from a text file containing the SWAN usage statistics during July 2017.
{
FILE *f = fopen(
Form(
"%sSWAN2017.dat", dir.
Data()),
"r");
g->
SetTitle(
"SWAN Users during July 2017;Time;Number of Sessions");
char line[80];
char dt[20];
int i = 0;
while (fgets(line, 80, f)) {
sscanf(&line[20], "%f", &v);
strncpy(dt, line, 18);
dt[19] = '\0';
g->SetPoint(i,
TDatime(dt).Convert(), v);
i++;
}
fclose(f);
auto c =
new TCanvas(
"c",
"c", 950, 500);
g->SetLineWidth(3);
g->SetLineColor(kBlue);
g->GetYaxis()->CenterTitle();
auto xaxis = g->GetXaxis();
xaxis->SetTimeDisplay(1);
xaxis->CenterTitle();
xaxis->SetTimeFormat("%a %d");
xaxis->SetTimeOffset(0);
xaxis->SetNdivisions(-219);
xaxis->SetLimits(
TDatime(2017, 7, 3, 0, 0, 0).Convert(),
TDatime(2017, 7, 22, 0, 0, 0).Convert());
xaxis->SetLabelSize(0.025);
xaxis->CenterLabels();
}
- Authors
- Danilo Piparo, Olivier Couet
Definition in file timeSeriesFromCSV.C.

 ROOT 6.12/07 - Reference Guide Generated on Sat Sep 29 2018 23:41:44 (GVA Time) using Doxygen 1.8.13.