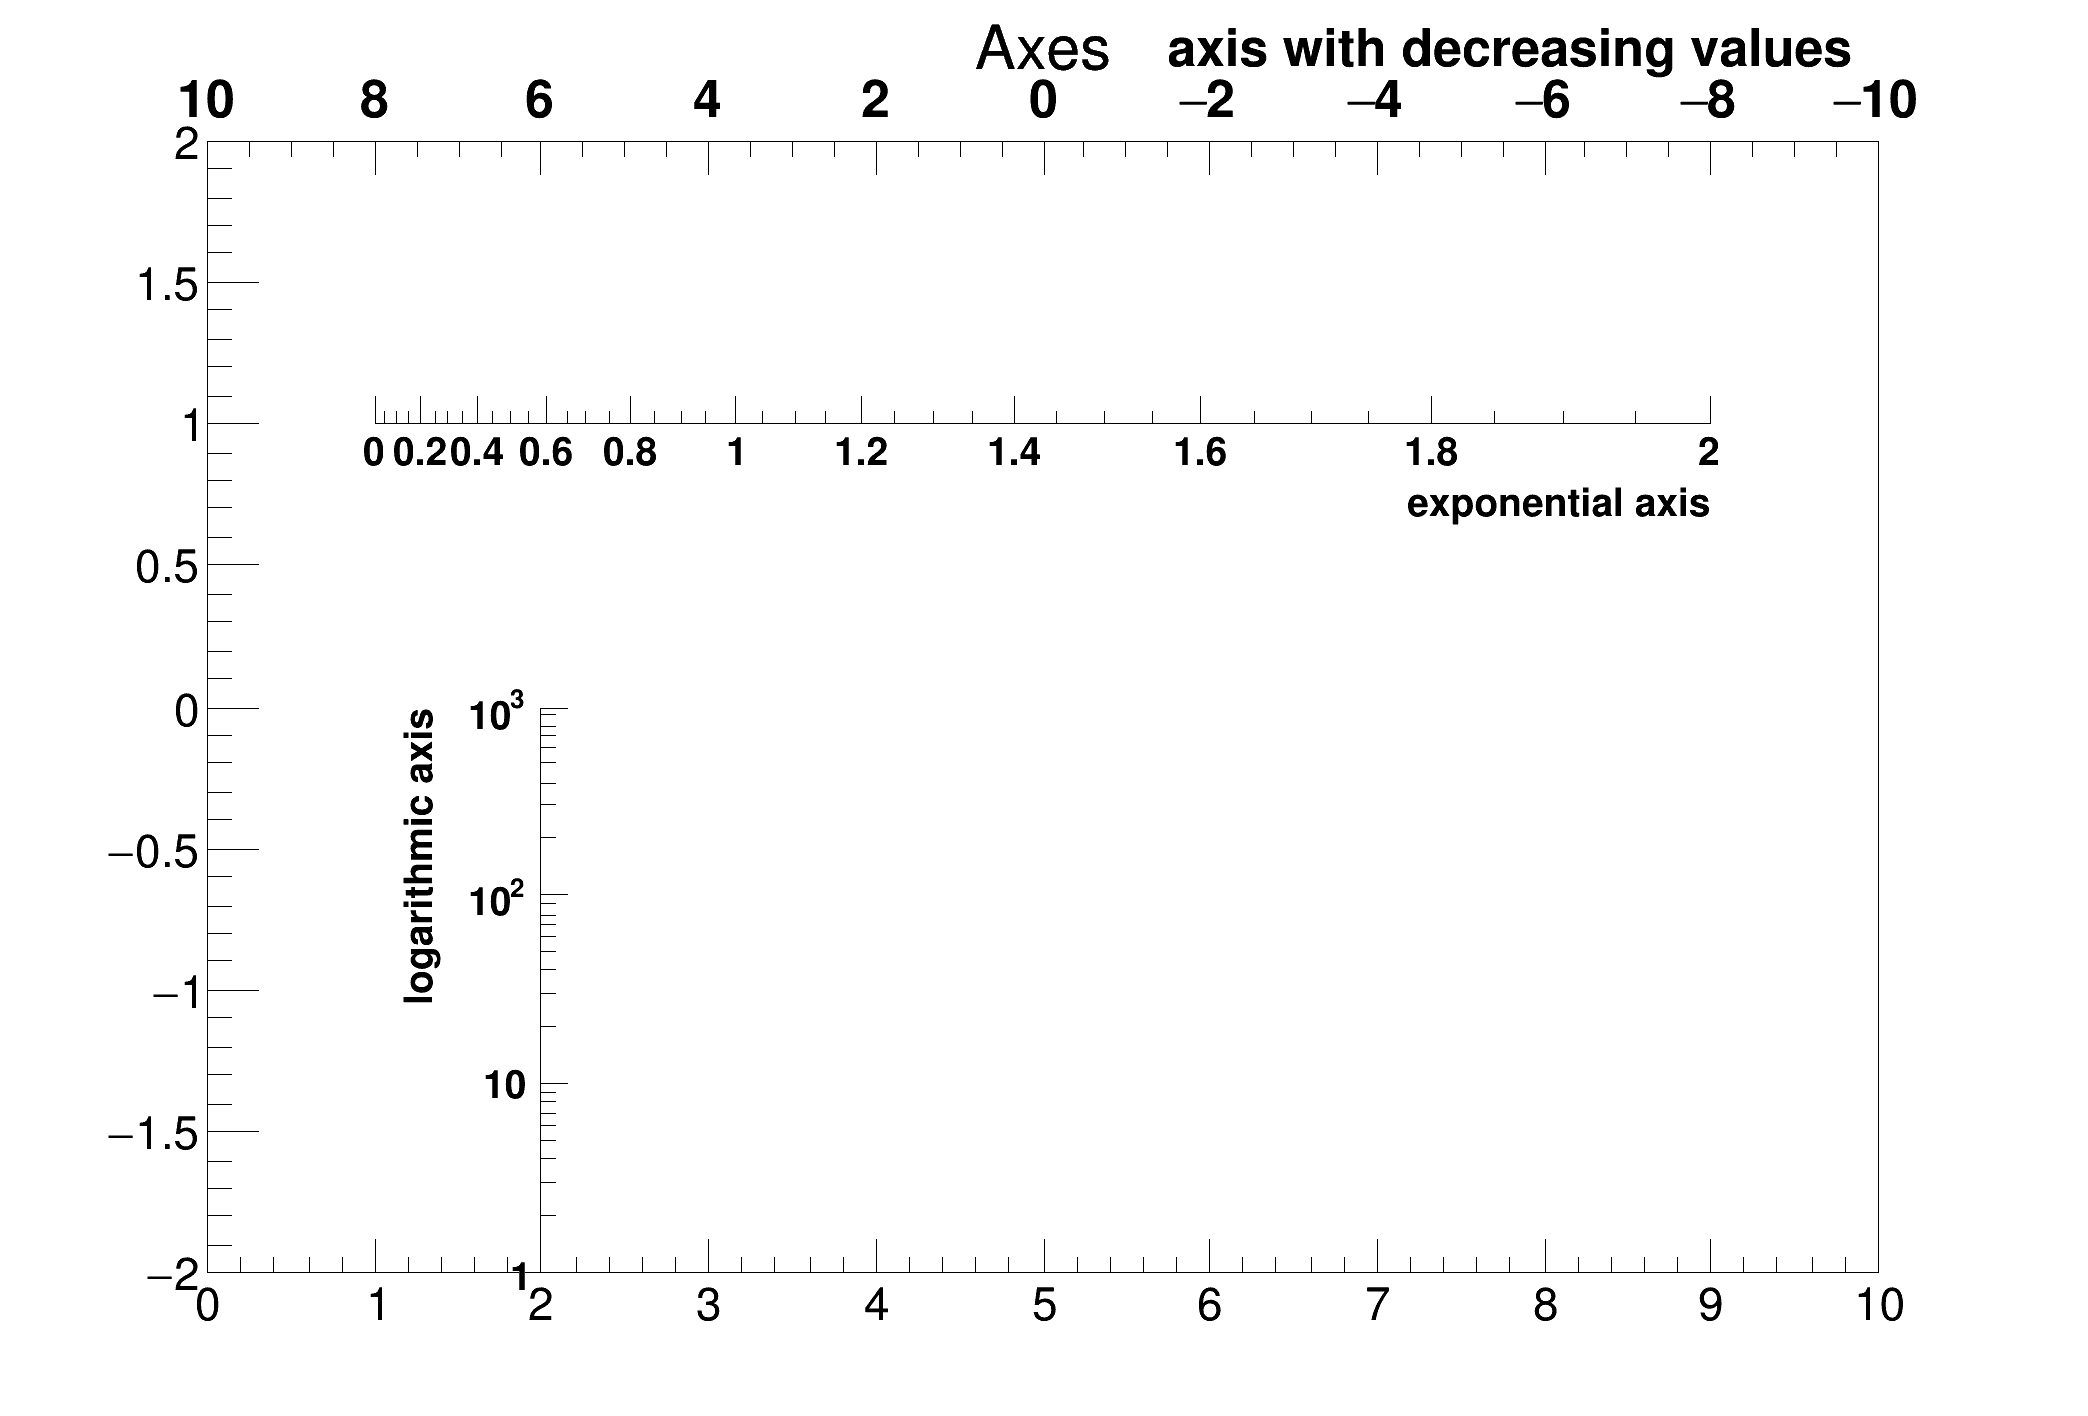
 Example illustrating how to draw TGaxis with labels defined by a function.
void gaxis2(){
TH2F *h2 =
new TH2F(
"h",
"Axes",100,0,10,100,-2,2);
A1->
SetTitle(
"axis with decreasing values");
TF1 *f2 =
new TF1(
"f2",
"exp(x)",0,2);
TF1 *f3 =
new TF1(
"f3",
"log10(x)",1,1000);
}
R__EXTERN TStyle * gStyle
void SetTitleOffset(Float_t titleoffset=1)
void SetTitleSize(Float_t titlesize)
virtual void SetTitle(const char *title="")
Change the title of the axis.
void SetLabelSize(Float_t labelsize)
virtual void Draw(Option_t *option="")
Draw this histogram with options.
2-D histogram with a float per channel (see TH1 documentation)}
virtual void Draw(Option_t *option="")
Default Draw method for all objects.
void SetOptStat(Int_t stat=1)
The type of information printed in the histogram statistics box can be selected via the parameter mod...
- Author
- Olivier Couet
Definition in file gaxis2.C.


 Example illustrating how to draw TGaxis with labels defined by a function.