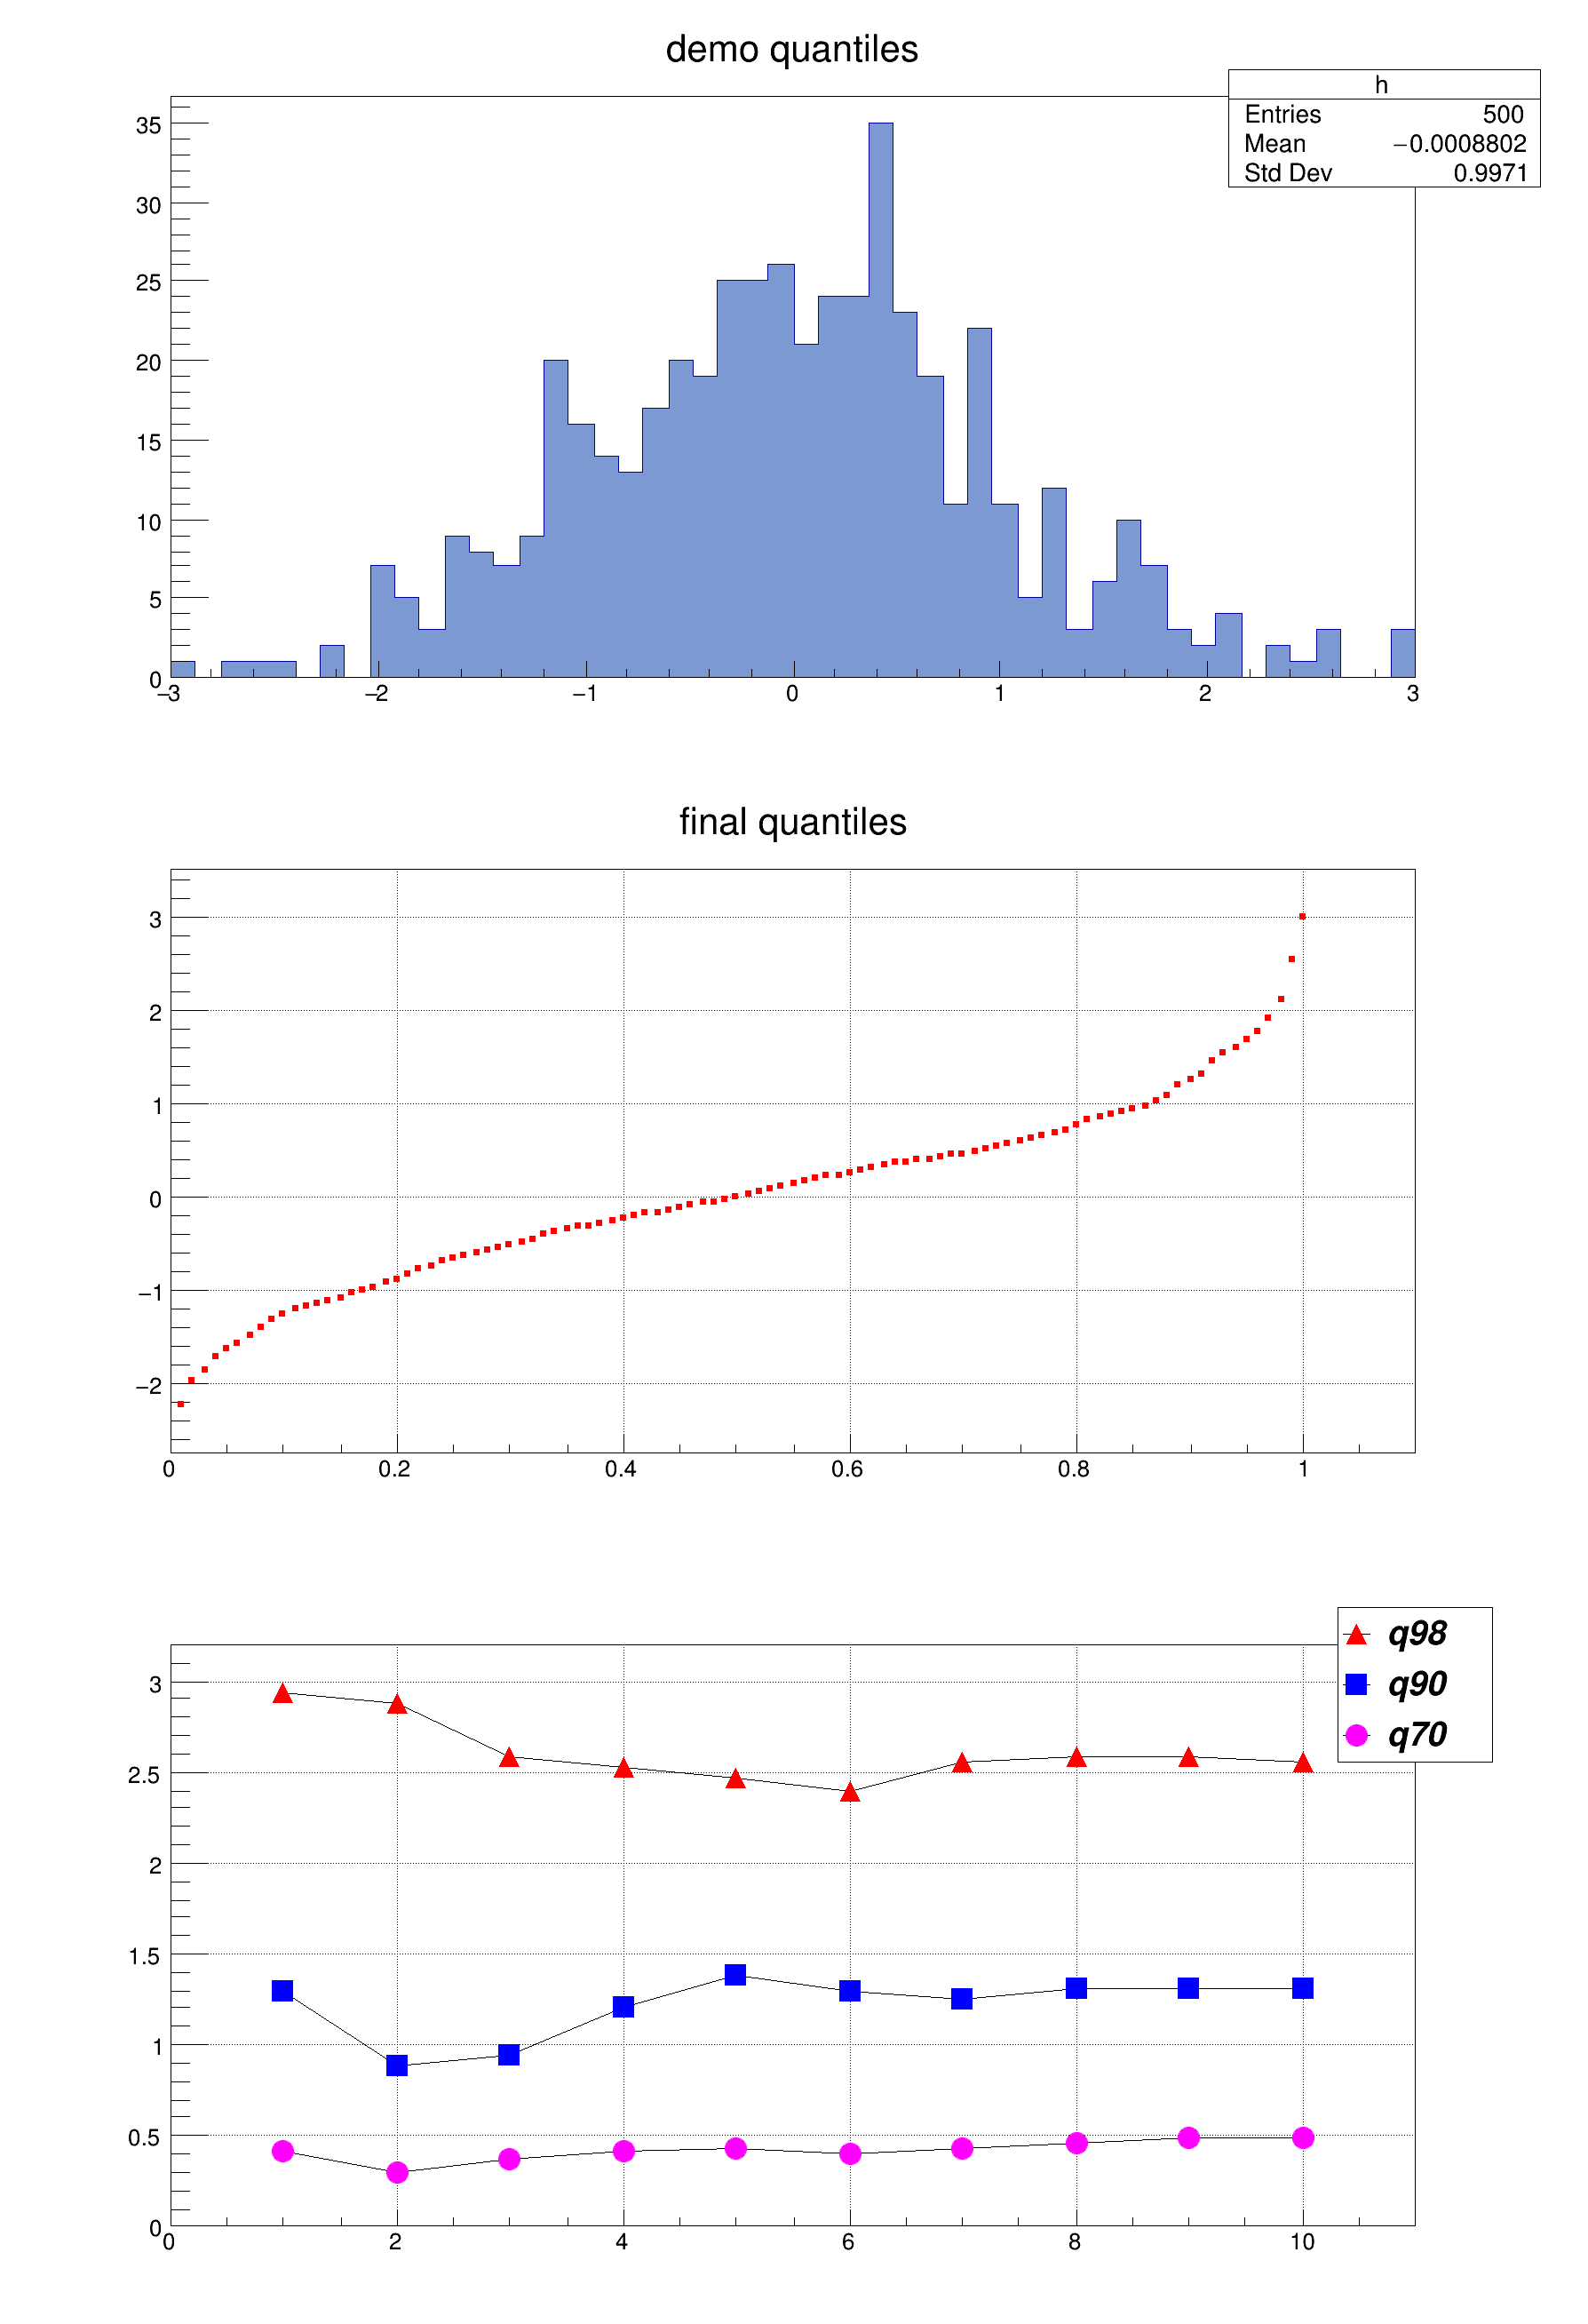
Loading [MathJax]/jax/input/TeX/config.js
Logo ROOT   6.16/01
Reference Guide
All Classes Namespaces Files Functions Variables Typedefs Enumerations Enumerator Properties Friends Macros Modules Pages
quantiles.C File Reference

Detailed Description

View in nbviewer Open in SWAN Demo for quantiles

void quantiles() {
const Int_t nq = 100;
const Int_t nshots = 10;
Double_t xq[nq]; // position where to compute the quantiles in [0,1]
Double_t yq[nq]; // array to contain the quantiles
for (Int_t i=0;i<nq;i++) xq[i] = Float_t(i+1)/nq;
TGraph *gr70 = new TGraph(nshots);
TGraph *gr90 = new TGraph(nshots);
TGraph *gr98 = new TGraph(nshots);
TH1F *h = new TH1F("h","demo quantiles",50,-3,3);
for (Int_t shot=0;shot<nshots;shot++) {
h->FillRandom("gaus",50);
h->GetQuantiles(nq,yq,xq);
gr70->SetPoint(shot,shot+1,yq[70]);
gr90->SetPoint(shot,shot+1,yq[90]);
gr98->SetPoint(shot,shot+1,yq[98]);
}
//show the original histogram in the top pad
TCanvas *c1 = new TCanvas("c1","demo quantiles",10,10,600,900);
c1->Divide(1,3);
c1->cd(1);
h->SetFillColor(38);
h->Draw();
// show the final quantiles in the middle pad
c1->cd(2);
gPad->SetGrid();
TGraph *gr = new TGraph(nq,xq,yq);
gr->SetTitle("final quantiles");
gr->Draw("ap");
// show the evolution of some quantiles in the bottom pad
c1->cd(3);
gPad->DrawFrame(0,0,nshots+1,3.2);
gPad->SetGrid();
gr98->SetMarkerStyle(22);
gr98->Draw("lp");
gr90->SetMarkerStyle(21);
gr90->Draw("lp");
gr70->SetMarkerStyle(20);
gr70->Draw("lp");
// add a legend
TLegend *legend = new TLegend(0.85,0.74,0.95,0.95);
legend->SetTextFont(72);
legend->SetTextSize(0.05);
legend->AddEntry(gr98," q98","lp");
legend->AddEntry(gr90," q90","lp");
legend->AddEntry(gr70," q70","lp");
legend->Draw();
}
#define h(i)
Definition: RSha256.hxx:106
int Int_t
Definition: RtypesCore.h:41
double Double_t
Definition: RtypesCore.h:55
float Float_t
Definition: RtypesCore.h:53
@ kRed
Definition: Rtypes.h:63
@ kMagenta
Definition: Rtypes.h:63
@ kBlue
Definition: Rtypes.h:63
#define gPad
Definition: TVirtualPad.h:286
virtual void SetMarkerColor(Color_t mcolor=1)
Set the marker color.
Definition: TAttMarker.h:38
virtual void SetMarkerStyle(Style_t mstyle=1)
Set the marker style.
Definition: TAttMarker.h:40
virtual void SetMarkerSize(Size_t msize=1)
Set the marker size.
Definition: TAttMarker.h:41
virtual void SetTextFont(Font_t tfont=62)
Set the text font.
Definition: TAttText.h:45
virtual void SetTextSize(Float_t tsize=1)
Set the text size.
Definition: TAttText.h:46
The Canvas class.
Definition: TCanvas.h:31
A Graph is a graphics object made of two arrays X and Y with npoints each.
Definition: TGraph.h:41
virtual void SetPoint(Int_t i, Double_t x, Double_t y)
Set x and y values for point number i.
Definition: TGraph.cxx:2200
virtual void SetTitle(const char *title="")
Set graph title.
Definition: TGraph.cxx:2232
virtual void Draw(Option_t *chopt="")
Draw this graph with its current attributes.
Definition: TGraph.cxx:747
1-D histogram with a float per channel (see TH1 documentation)}
Definition: TH1.h:571
This class displays a legend box (TPaveText) containing several legend entries.
Definition: TLegend.h:23
TLegendEntry * AddEntry(const TObject *obj, const char *label="", Option_t *option="lpf")
Add a new entry to this legend.
Definition: TLegend.cxx:330
virtual void Draw(Option_t *option="")
Draw this legend with its current attributes.
Definition: TLegend.cxx:423
return c1
Definition: legend1.C:41
TGraphErrors * gr
Definition: legend1.C:25
Authors
Rene Brun, Eddy Offermann

Definition in file quantiles.C.