 |
ROOT 6.16/01 Reference Guide |
| |
ROOT 6.16/01 Reference Guide |
Namespaces | |
| namespace | ratioplot3 |

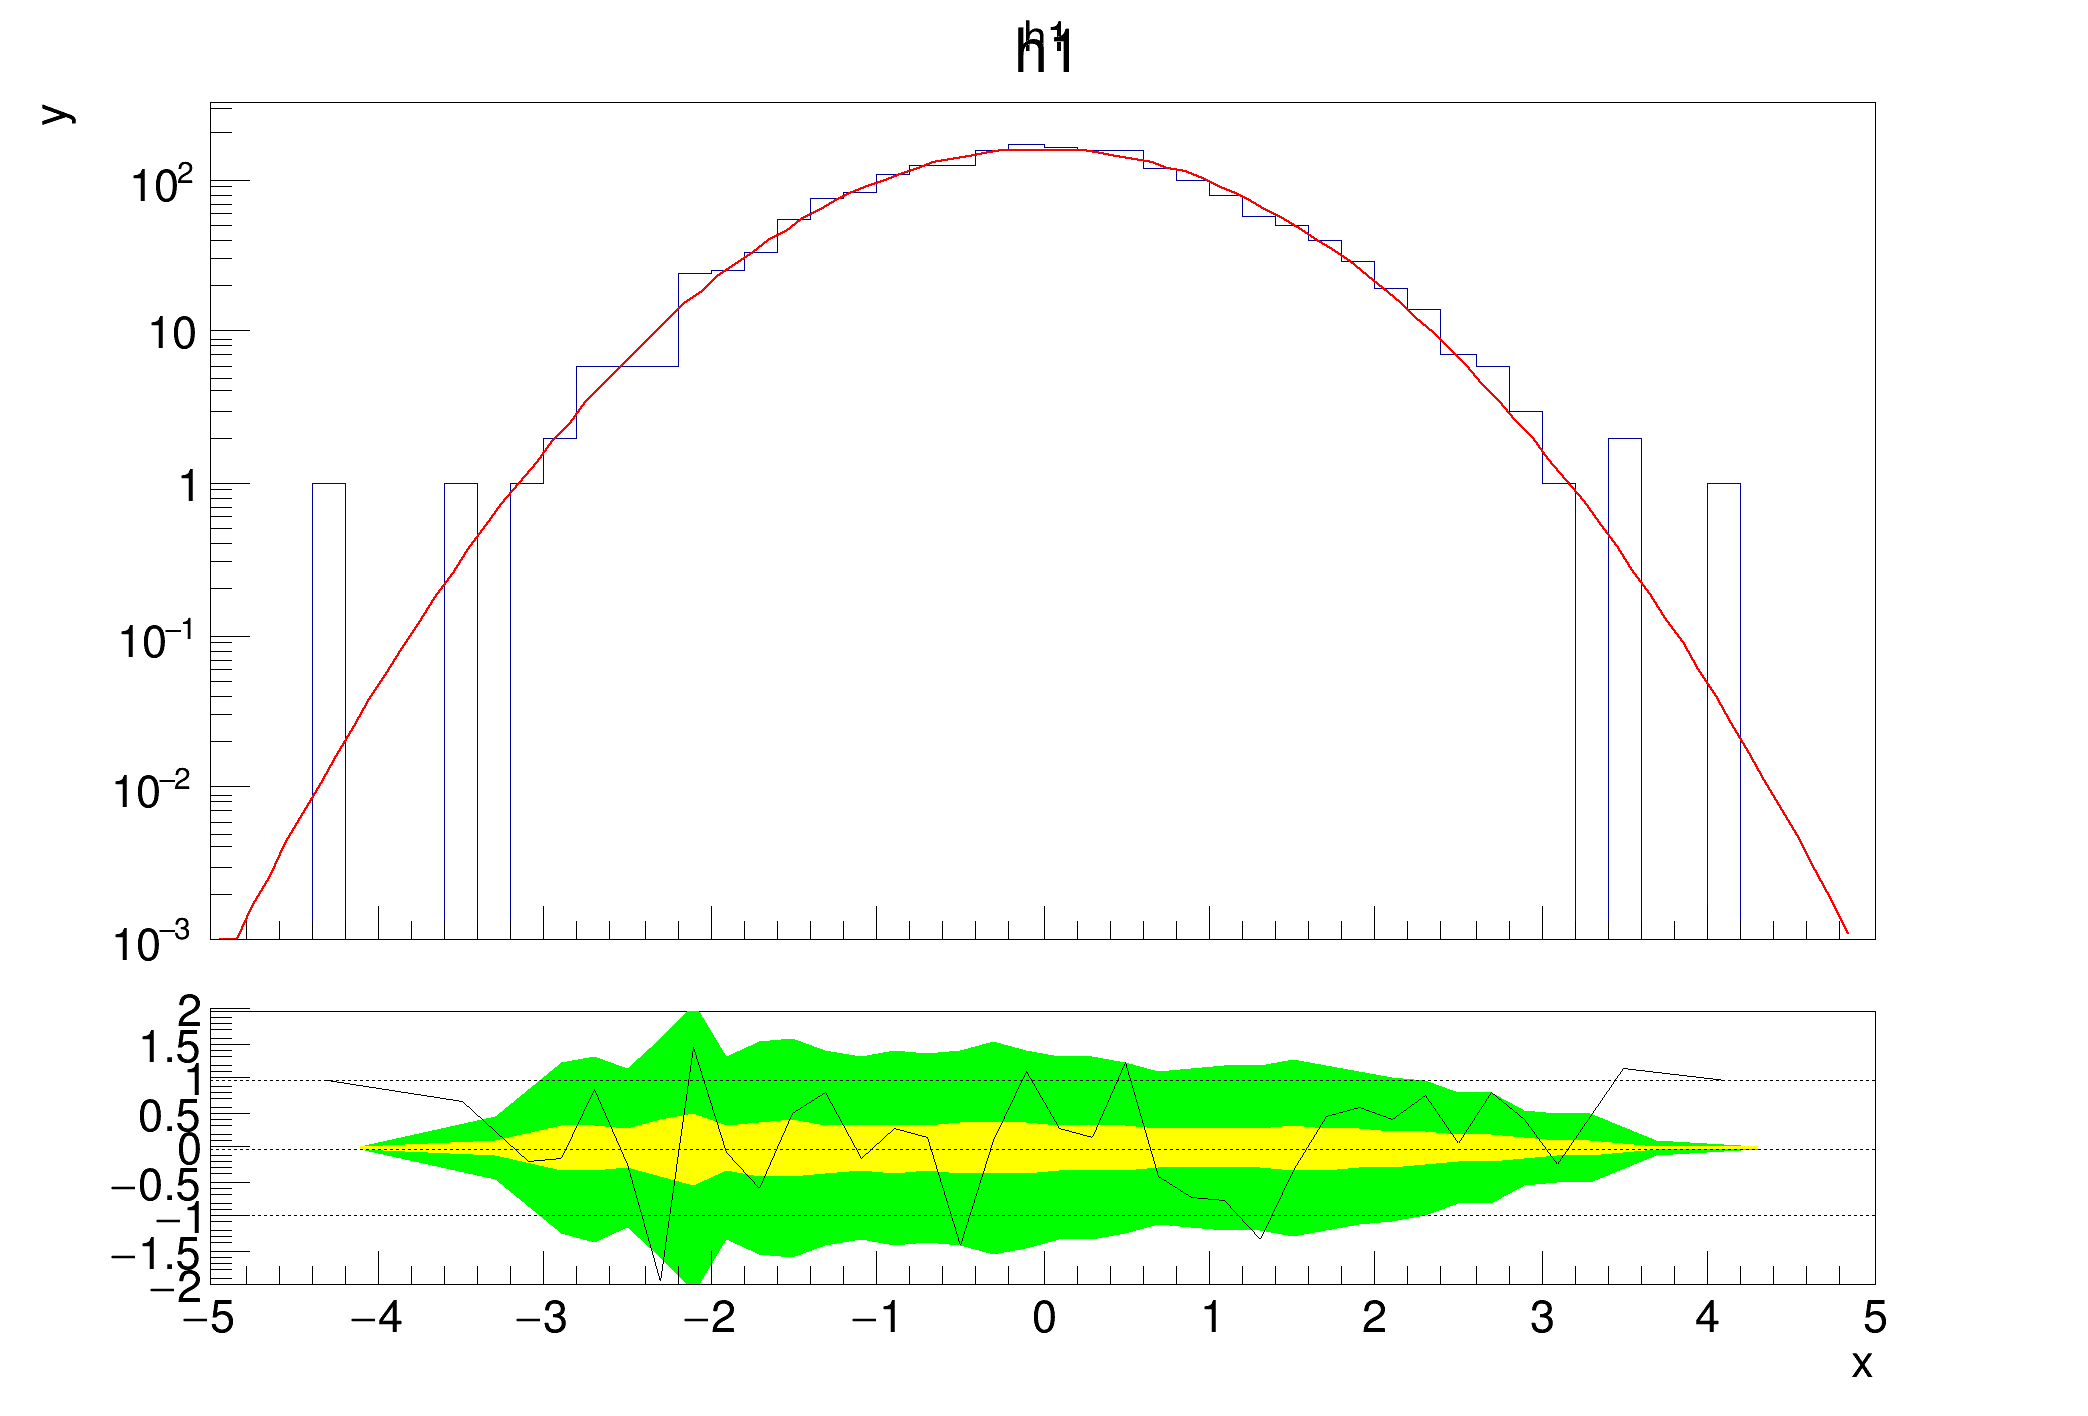
![]() Example which shows how you can get the graph of the lower plot and set the y axis range for it.
Example which shows how you can get the graph of the lower plot and set the y axis range for it.
Since the lower plot is not created until TRatioPlot::Draw is called, you can only use the method afterwards. Inspired by the tutorial of Paul Gessinger.
Definition in file ratioplot3.py.
 ROOT 6.16/01 - Reference Guide Generated on Sun Dec 19 2021 22:28:14 (GVA Time) using Doxygen 1.9.3 (234637167bd5d39d32bf51f755d58253441f123a).