Hi,
I have a question about plotting the residual of a RooFit fit. I have tried several ways now, but none seems to work properly, therefore I am asking now and would be happy about suggestions.
The situation is the following (note: my script is in python):
I do an extended likelihood fit with RooFit using binned templates (i.e. from histograms). The fitting code is the following:
# Define fit variable axis
varX = RooRealVar("varX",hdata.GetXaxis().GetTitle(),fitRange_min,fitRange_max)

# Define variables for fitted signal and QCD events
nsig  = RooRealVar("nsig","estimated number of events in the signal+MC backgrounds",ndata*2./3., 0.000001, ndata)
nqcd  = RooRealVar("nqcd","estimated number of events in the QCD background",ndata*1./3., 0.000001, ndata)

# Get the histograms for RooFit
data     = RooDataHist("data" ,"data in signal region" , RooArgList(varX), hdata)
sig      = RooDataHist("sigEW","signal and other MC backgrounds in signal region", RooArgList(varX), hSigEW)
qcd      = RooDataHist("qcdEW","QCD distribution from control region"  , RooArgList(varX), hQCD)

# Set the histograms for sig and qcd as PDFs
sigModel = RooHistPdf("sigModel","RooFit template for signal and other MC backgrounds", RooArgSet(varX), sig)
qcdModel = RooHistPdf("qcdModel","RooFit template for QCD backgrounds" , RooArgSet(varX), qcd)

# Prepare extended likelihood fit
sigShape = RooExtendPdf("sigShape","Signal shape pdf", sigModel, nsig)
qcdShape = RooExtendPdf("qcdShape","QCD shape pdf" , qcdModel, nqcd)

# Combine the models
combModel = RooAddPdf("combModel","Combined model for signal+EW and QCD", RooArgList(sigShape,qcdShape))

# Fit
fitResult = combModel.fitTo(data, RooFit.Extended(True), RooFit.Save(True), RooFit.Minos(True), RooFit.PrintLevel(-1))
Then I plot the fit result:
# Set up the plotting with RooFit
xframe = varX.frame()
data.plotOn(xframe)
combModel.plotOn(xframe, RooFit.VisualizeError(fitResult))
data.plotOn(xframe) # plot again so that it is on top of the errors
combModel.plotOn(xframe, RooFit.LineColor(4))
combModel.plotOn(xframe, RooFit.Components("sigShape"), RooFit.LineColor(ROOT.kYellow))
combModel.plotOn(xframe, RooFit.Components("qcdShape"), RooFit.LineColor(ROOT.kOrange))
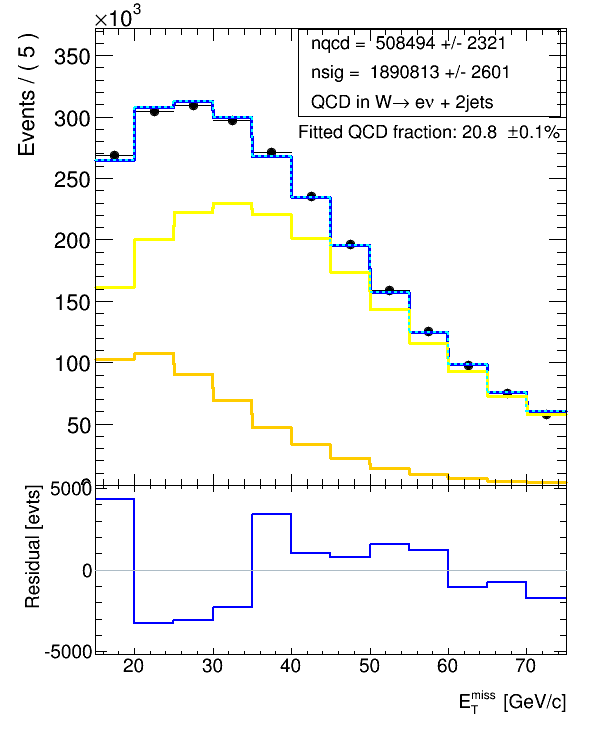
xframe.Draw()And then in a lower pad on the same canvas (the canvas is split into two pads), I would like to plot the residual, i.e. the difference between the data points and the fit result. And this is where my problem is:
I found the function residHist() which should return the residual:
hResidual = xframe.residHist()
xframe2 = varX.frame(RooFit.Title("Residual Distribution"))
xframe2.addPlotable(hResidual,"P")
xframe2.Draw()
but this does not change, when I change parameters in the fit such that it should improve - I see the improvement in the upper plot of the fit, but not in the residual. So, I checked the reference and the code for that function again, and it says:
(see root.cern.ch/root/html/RooPlot. … :residHist)
When I give it the name of my combined model: “combModel” it however tells me, that it cannot find it and looking at the code, this make sense as it looks for:
and my model is not of the type RooCurve. I don’t know however how to convert my RooAddPdf into a curve, so my first question is, is there a way how to get a RooCurve from my RooAddPdf in order to calculate a valid residual?
Alternatively, I thought I could just retrieve the histogram from RooAddPdf and calculate the residual myself. So, I do:
hCombModel = combModel.createHistogram("fitResult_"+jetmult,varX)but this is then normalized (integral is 1) and I need to normalize to the number of events otherwise the residual determined from this does not make too much sense.
In the documentation for the createHistogram function (root.cern.ch/root/html/RooAbsRe … eHistogram) , I see the following option:
which I thought should return me what I want, but when I include it, I get an error:
I understand that this option exists only for extended pdfs, but I used an extended likelihood fit. So, is there something that I missed? I also thought that it might need other classes from RooFit imported in python (I have: from ROOT import RooDataHist, RooFit, RooRealVar, RooArgList, RooHistPdf, RooArgSet, RooExtendPdf, RooAddPdf, RooAbsData, RooChi2Var, RooGaussian, RooProdPdf), but I couldn’t find what else it needs. I also thought that it might be the root version - I use root_5.34.04, but I see the option also in the documentation for root 5.34 (root.cern.ch/root/html534/RooAb … eHistogram).
So, I thought, I could try to manually scale the histogram with the number of events which I get from the fit:
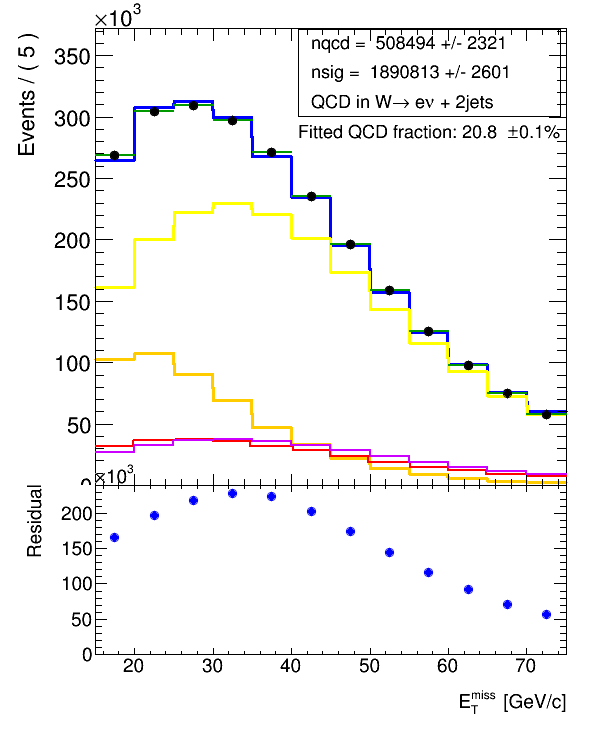
hCombModel.Scale(nqcd.getVal()+nsig.getVal())But then unfortunately, I don’t end up at the same normalization as what the combModel.plotOn(xframe, RooFit.LineColor(4)) gives, if I overlay the plot of hCombModel on the same upper pad (it is attached below) (in red) as also the RooFit results where plotted. You can see below, it doesn’t agree with the blue (combModel.plotOn(xframe)).
I also tried creating the histogram by obtaining the individual values. I do:
hCombModel_man = hdata.Clone("Comb_model_"+jetmult)
hCombModel_man.Reset("M")
for i_bin in xrange(1,hCombModel_man.GetNbinsX()+1):
    xvalue = hCombModel_man.GetBinCenter(i_bin)

    # get the content from the model
    varX.setVal(xvalue)
    content = combModel.getVal()

    # set the content in the histogram
    hCombModel_man.SetBinContent(i_bin,content)
hCombModel_man.SetLineColor(ROOT.kViolet)
hCombModel_man.Draw("same")
It is the violet histogram in the plot and it doesn’t agree with the red (which was from createHistogram()) although the normalization is roughly the same, nor with the blue (which is from combModel.plotOn(xframe)).
I have found out by empirical testing and printing some bin contents, that I need to scale the red histogram with a factor of about 8.3, in order to get the normalization right (i.e. to agree with the blue). I have however no idea why there should be a factor 8.3 involved here. The binning is 5GeV, so that also cannot be the reason.
So, now my question is: How do I correctly extract the histogram of the fit result with the proper normalization. Is there a way how I can get the normalization from the RooAddPdf combModel? I couldn’t find anything in the documentation. And why do I get different results (the shapes are slightly different) when I obtain the histogram with createHistogram() or fill it myself with getVal()?
I order to check that nothing goes wrong with the absolute normalization when using RooPlot instead of ROOT to draw the results, I replotted the data histogram (TH1D) on the same pad:
hdata.SetLineColor(ROOT.kGreen+2)
hdata.Draw("same")
and it exactly overlays with the black points from the data.plotOn(xframe) command.
After a few more investigations, I found out that actually for plotting the combModel with its intrinsic normalization after the fit, I have to do:
combModel.plotOn(xframe, RooFit.LineColor(4), RooFit.Normalization(1.0,RooAbsReal.RelativeExpected))because otherwise:
(see root.cern.ch/root/html/RooAbsRe … eal:plotOn ).
However, this doesn’t change the overall normalization of the fit result (blue) in any visible manner and thus doesn’t resolve my normalization issue for the histogram from createHistogram().
So, what am I missing? How do I correctly get the residual for my binned extended likelihood fit with binned templates? You can see that I tried many things, but now I am at a loss of why it doesn’t work and what else to try.
I would therefore be happy about any suggestions and explanations why the methods I tried do not work or how to make them work - and/or also for completely new suggestions how to correctly get the residual.
Thanks a lot.
Cheers
Valerie