Dear Rooters,
I am using TGraph to make a huge plot with a relatively large set of points (~2000 temperature vs time points), but I’ve experienced for the first time a strange and uncommon issue.
As far as I can see, the problem in not related to the number of points, but looks to happen when you have points quite close each other on the canvas.
I have extracted a small excerpt showing the effect:
{
int n=100;
float x[n], y[n];
TCanvas *c = new TCanvas;
for (i=0;i<n;i++) {x[i]=i; y[i]= 0.;}
y[6]=1;
x[16]=x[15]+0.2;
x[17]=x[15]+0.4;
x[18]=x[15]+0.6;
y[16]=1-0.02;
y[17]=1;
y[18]=1-0.02;
x[26]=x[25]+0.2;
x[27]=x[25]+0.4;
x[28]=x[25]+0.6;
y[26]=1;
y[27]=1-0.02;
y[28]=1;
h= new TGraph(n,x,y);
h->GetXaxis()->SetRangeUser(0,100);
h->SetMarkerStyle(21); h->SetMarkerSize(0.2); h->SetLineWidth(1);
h->Draw("");
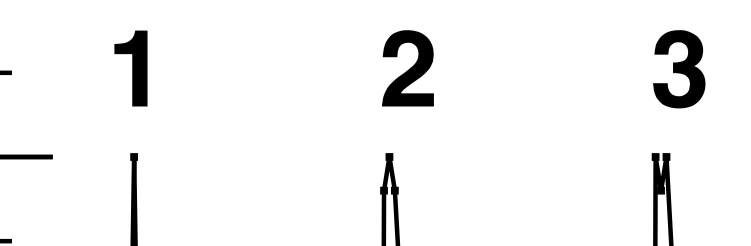
char txt0[] = "1"; TText *t0=new TText(); t0->DrawText(5,1.03,txt0);
char txt1[] = "2"; TText *t1=new TText(); t1->DrawText(15,1.03,txt1);
char txt2[] = "3"; TText *t2=new TText(); t2->DrawText(25,1.03,txt2);
c->Print("esempio.pdf","pdf");
}As you can barely see in the canvas (but you’ll see very well by zooming into the pdf), strange spikes appear at the edge of the lines connecting the points when they are close each other (see #2 and #3).
In normal conditions these spikes are obviously not present (see #1).
As a results, my temperature plot looks a bit strange and quite ugly!
Is there a Draw option to avoid this issue?
I cannot use “C” because it introduces spurious wrinkles, I do need straight lines…
Obviously, the spikes disappear if you zoom in the canvas around the concerned points, before exporting in pdf, but I cannot do that with my data.
The presence of the markers is not essential, the problem is still present if you remove the markers, although probably you wouldn’t notice it. The presence of the markers just make it much more visible.
Any suggestions?
Thank you in advance!
Nicola