void seism() {
TStopwatch sw; sw.Start();
TDatime dtime;
gStyle->SetTimeOffset(dtime.Convert());
TCanvas *c1 = new TCanvas("c1","Time on axis",10,10,1000,500);
c1->SetFillColor(42);
c1->SetFrameFillColor(33);
c1->SetGrid();
Float_t bintime = 1;
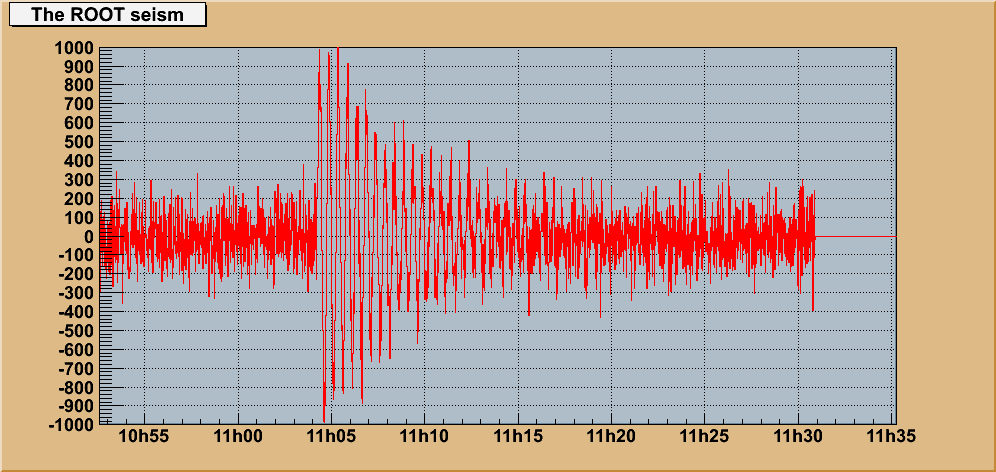
TH1F *ht = new TH1F("ht","The ROOT seism",10,0,10*bintime);
Float_t signal = 1000;
ht->SetMaximum( signal);
ht->SetMinimum(-signal);
ht->SetStats(0);
ht->SetLineColor(2);
ht->GetXaxis()->SetTimeDisplay(1);
ht->GetYaxis()->SetNdivisions(520);
ht->Draw();
for (Int_t i=1;i<2300;i++) {
Float_t noise = gRandom->Gaus(0,120);
if (i > 700) noise += signal*sin((i-700.)*6.28/30)*exp((700.-i)/300.);
ht->SetBinContent(i,noise);
c1->Modified();
c1->Update();
gSystem->ProcessEvents();
}
printf("Real Time = %8.3fs, Cpu Time = %8.3fs\n",sw.RealTime(),sw.CpuTime());
}
|
|