TCanvas *ContourList(){
const Double_t PI = TMath::Pi();
TCanvas* c = new TCanvas("c","Contour List",0,0,600,600);
c->SetRightMargin(0.15);
c->SetTopMargin(0.15);
Int_t i, j, TotalConts;
Int_t nZsamples = 80;
Int_t nPhiSamples = 80;
Double_t HofZwavelength = 4.0;
Double_t dZ = HofZwavelength/(Double_t)(nZsamples - 1);
Double_t dPhi = 2*PI/(Double_t)(nPhiSamples - 1);
TArrayD z(nZsamples);
TArrayD HofZ(nZsamples);
TArrayD phi(nPhiSamples);
TArrayD FofPhi(nPhiSamples);
for ( i = 0; i < nZsamples; i++) {
z[i] = (i)*dZ - HofZwavelength/2.0;
HofZ[i] = SawTooth(z[i], HofZwavelength);
}
for(Int_t i=0; i < nPhiSamples; i++){
phi[i] = (i)*dPhi;
FofPhi[i] = sin(phi[i]);
}
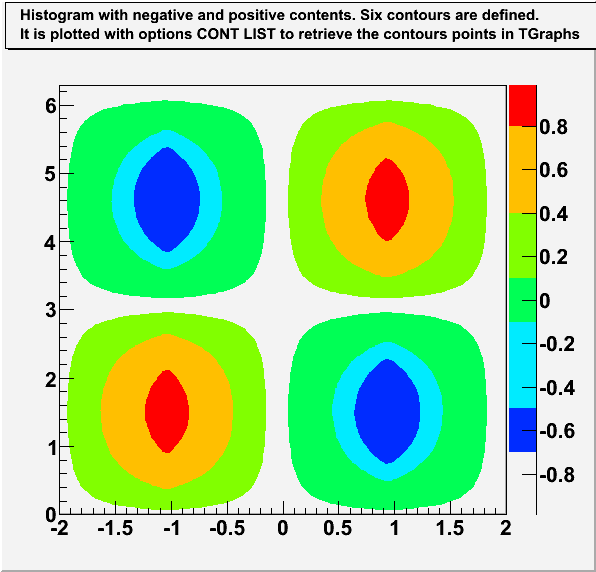
TH2D *HistStreamFn = new TH2D("HstreamFn",
"#splitline{Histogram with negative and positive contents. Six contours are defined.}{It is plotted with options CONT LIST to retrieve the contours points in TGraphs}",
nZsamples, z[0], z[nZsamples-1], nPhiSamples, phi[0], phi[nPhiSamples-1]);
for (Int_t i = 0; i < nZsamples; i++) {
for(Int_t j = 0; j < nPhiSamples; j++){
HistStreamFn->SetBinContent(i,j, HofZ[i]*FofPhi[j]);
}
}
gStyle->SetPalette(1);
gStyle->SetOptStat(0);
gStyle->SetTitleW(0.99);
gStyle->SetTitleH(0.08);
Double_t contours[6];
contours[0] = -0.7;
contours[1] = -0.5;
contours[2] = -0.1;
contours[3] = 0.1;
contours[4] = 0.4;
contours[5] = 0.8;
HistStreamFn->SetContour(6, contours);
HistStreamFn->Draw("CONT Z LIST");
c->Update();
TObjArray *conts = (TObjArray*)gROOT->GetListOfSpecials()->FindObject("contours");
TList* contLevel = NULL;
TGraph* curv = NULL;
Int_t nGraphs = 0;
Int_t TotalConts = 0;
if (conts == NULL){
printf("*** No Contours Were Extracted!\n");
TotalConts = 0;
return;
} else {
TotalConts = conts->GetSize();
}
printf("TotalConts = %d\n", TotalConts);
for(i = 0; i < TotalConts; i++){
contLevel = (TList*)conts->At(i);
printf("Contour %d has %d Graphs\n", i, contLevel->GetSize());
nGraphs += contLevel->GetSize();
}
nGraphs = 0;
TCanvas* c1 = new TCanvas("c1","Contour List",610,0,600,600);
c1->SetTopMargin(0.15);
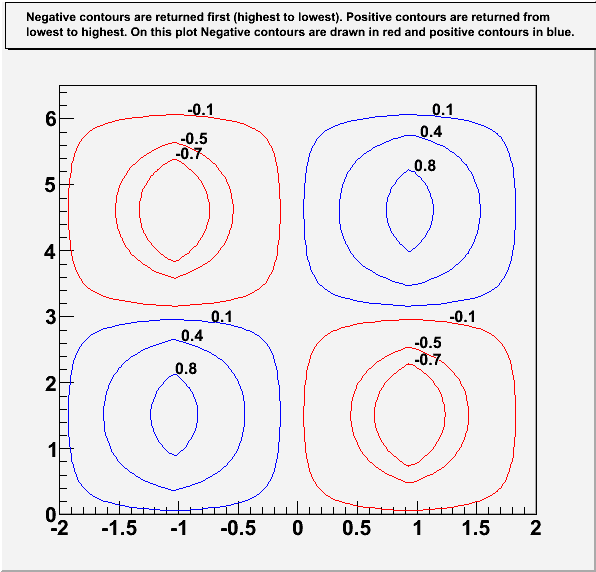
TH2F *hr = new TH2F("hr",
"#splitline{Negative contours are returned first (highest to lowest). Positive contours are returned from}{lowest to highest. On this plot Negative contours are drawn in red and positive contours in blue.}",
2, -2, 2, 2, 0, 6.5);
hr->Draw();
Double_t x0, y0, z0;
TLatex l;
l.SetTextSize(0.03);
char val[20];
for(i = 0; i < TotalConts; i++){
contLevel = (TList*)conts->At(i);
if (i<3) z0 = contours[2-i];
else z0 = contours[i];
printf("Z-Level Passed in as: Z = %f\n", z0);
curv = (TGraph*)contLevel->First();
for(j = 0; j < contLevel->GetSize(); j++){
curv->GetPoint(0, x0, y0);
if (z0<0) curv->SetLineColor(kRed);
if (z0>0) curv->SetLineColor(kBlue);
nGraphs ++;
printf("\tGraph: %d -- %d Elements\n", nGraphs,curv->GetN());
curv->Draw("C");
sprintf(val,"%g",z0);
l.DrawLatex(x0,y0,val);
curv = (TGraph*)contLevel->After(curv);
}
}
c1->Update();
printf("\n\n\tExtracted %d Contours and %d Graphs \n", TotalConts, nGraphs );
gStyle->SetTitleW(0.);
gStyle->SetTitleH(0.);
return c1;
}
Double_t SawTooth(Double_t x, Double_t WaveLen){
Double_t y;
if ( (x < -WaveLen/2) || (x > WaveLen/2)) y = -99999999;
if (x <= -WaveLen/4) {
y = x + 2.0;
} else if ((x > -WaveLen/4) && (x <= WaveLen/4)) {
y = -x ;
} else if (( x > WaveLen/4) && (x <= WaveLen/2)) {
y = x - 2.0;
}
return y;
}
|
|