| myfit.C: Get in memory an histogram from a root file and fit a user defined function. | Fitting tutorials |
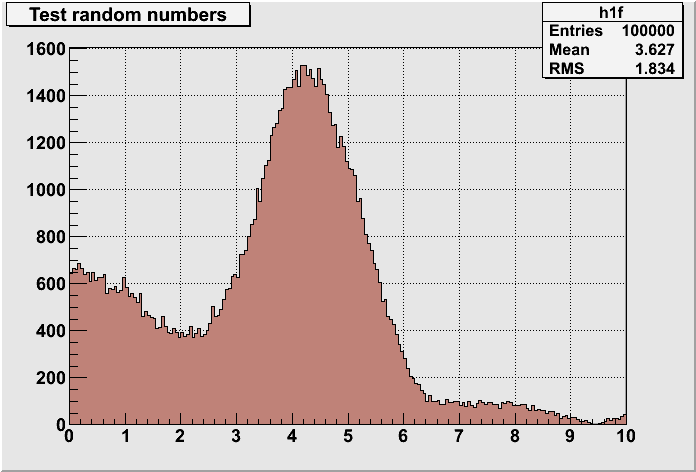
qa2.C: Fill a 1-D histogram from a parametric function
void qa2() { //Fill a 1-D histogram from a parametric function TCanvas *c1 = new TCanvas("c1","The FillRandom example",0,0,700,500); c1->SetFillColor(18); gBenchmark->Start("fillrandom"); // // A function (any dimension) or a formula may reference // an already defined formula // form1 = new TFormula("form1","abs(sin(x)/x)"); sqroot = new TF1("sqroot","x*gaus(0) + [3]*form1",0,10); sqroot->SetParameters(10,4,1,20); // // Create a one dimensional histogram (one float per bin) // and fill it following the distribution in function sqroot. // h1f = new TH1F("h1f","Test random numbers",200,0,10); h1f->SetFillColor(45); h1f->FillRandom("sqroot",100000); h1f->Draw(); lfunction = new TPaveLabel(5,39,9.8,46,"The sqroot function"); lfunction->SetFillColor(41); c1->SetGridx(); c1->SetGridy(); c1->GetFrame()->SetFillColor(42); c1->GetFrame()->SetBorderMode(-1); c1->GetFrame()->SetBorderSize(5); h1f->SetDirectory(0); c1->Update(); sqroot->SetParameters(200,4,1,20); } qa2.C:1 qa2.C:2 qa2.C:3 qa2.C:4 qa2.C:5 qa2.C:6 qa2.C:7 qa2.C:8 qa2.C:9 qa2.C:10 qa2.C:11 qa2.C:12 qa2.C:13 qa2.C:14 qa2.C:15 qa2.C:16 qa2.C:17 qa2.C:18 qa2.C:19 qa2.C:20 qa2.C:21 qa2.C:22 qa2.C:23 qa2.C:24 qa2.C:25 qa2.C:26 qa2.C:27 qa2.C:28 qa2.C:29 qa2.C:30 qa2.C:31 qa2.C:32 qa2.C:33 qa2.C:34 qa2.C:35 qa2.C:36 qa2.C:37 qa2.C:38 |
|