| gerrors2.C: Draw two graphs with error bars | TGraph, TGraphErrors, etc | graph2derrorsfit.C: Create, Draw and fit a TGraph2DErrors |
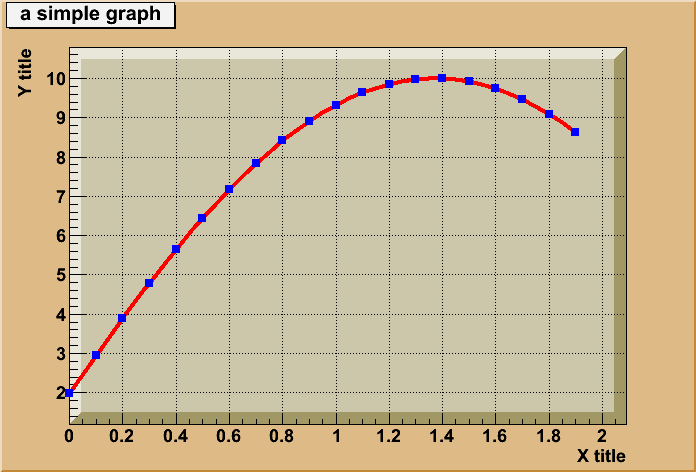
graph.C: Draw a simple graph
void graph() { //Draw a simple graph // To see the output of this macro, click begin_html <a href="gif/graph.gif">here</a>. end_html //Author: Rene Brun TCanvas *c1 = new TCanvas("c1","A Simple Graph Example",200,10,700,500); c1->SetFillColor(42); c1->SetGrid(); const Int_t n = 20; Double_t x[n], y[n]; for (Int_t i=0;i<n;i++) { x[i] = i*0.1; y[i] = 10*sin(x[i]+0.2); printf(" i %i %f %f \n",i,x[i],y[i]); } gr = new TGraph(n,x,y); gr->SetLineColor(2); gr->SetLineWidth(4); gr->SetMarkerColor(4); gr->SetMarkerStyle(21); gr->SetTitle("a simple graph"); gr->GetXaxis()->SetTitle("X title"); gr->GetYaxis()->SetTitle("Y title"); gr->Draw("ACP"); // TCanvas::Update() draws the frame, after which one can change it c1->Update(); c1->GetFrame()->SetFillColor(21); c1->GetFrame()->SetBorderSize(12); c1->Modified(); } graph.C:1 graph.C:2 graph.C:3 graph.C:4 graph.C:5 graph.C:6 graph.C:7 graph.C:8 graph.C:9 graph.C:10 graph.C:11 graph.C:12 graph.C:13 graph.C:14 graph.C:15 graph.C:16 graph.C:17 graph.C:18 graph.C:19 graph.C:20 graph.C:21 graph.C:22 graph.C:23 graph.C:24 graph.C:25 graph.C:26 graph.C:27 graph.C:28 graph.C:29 graph.C:30 graph.C:31 graph.C:32 graph.C:33 graph.C:34 |
|