| h1chain.C: Creates a TChain to be used by the h1analysis.C class | Trees I/O, Queries, Graphics | hvector.C: This tutorials demonstrate how to store and restore simple vectors |
htest.C: Example illustrating how to save histograms in Tree branches.
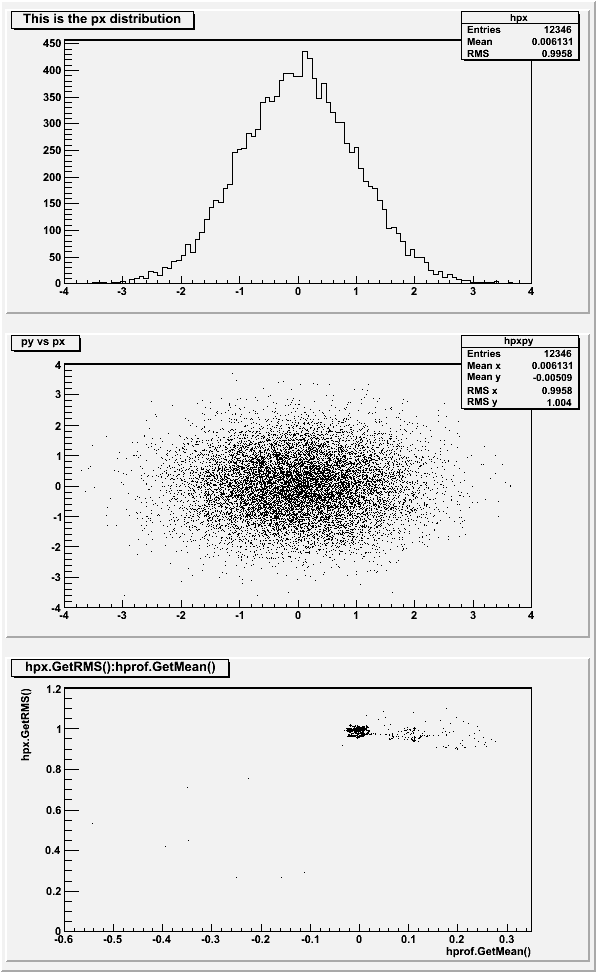
//Example illustrating how to save histograms in Tree branches. //To run this example, do // root > .L htest.C // root > htw() // root > htr1() // root > htr2() // root > htr3() // //Author: Rene Brun void htw() { //create a Tree with a few branches of type histogram //25000 entries are filled in the Tree //For each entry, the copy of 3 histograms is written //The data base will contain 75000 histograms. gBenchmark->Start("hsimple"); TFile f("ht.root","recreate"); TTree *T = new TTree("T","test"); TH1F *hpx = new TH1F("hpx","This is the px distribution",100,-4,4); TH2F *hpxpy = new TH2F("hpxpy","py vs px",40,-4,4,40,-4,4); TProfile *hprof = new TProfile("hprof","Profile of pz versus px",100,-4,4,0,20); T->Branch("hpx","TH1F",&hpx,32000,0); T->Branch("hpxpy","TH2F",&hpxpy,32000,0); T->Branch("hprof","TProfile",&hprof,32000,0); Float_t px, py, pz; for (Int_t i = 0; i < 25000; i++) { if (i%1000 == 0) printf("at entry: %d\n",i); gRandom->Rannor(px,py); pz = px*px + py*py; hpx->Fill(px); hpxpy->Fill(px,py); hprof->Fill(px,pz); T->Fill(); } T->Print(); f.Write(); gBenchmark->Show("hsimple"); } void htr1() { //connect Tree generated by htw and show histograms for entry 12345 TFile *f = new TFile("ht.root"); TTree *T = (TTree*)f->Get("T"); TH1F *hpx = 0; TH2F *hpxpy = 0; TProfile *hprof = 0; T->SetBranchAddress("hpx",&hpx); T->SetBranchAddress("hpxpy",&hpxpy); T->SetBranchAddress("hprof",&hprof); T->GetEntry(12345); TCanvas *c1 = new TCanvas("c1","test",10,10,600,1000); c1->Divide(1,3); c1->cd(1); hpx->Draw(); c1->cd(2); hpxpy->Draw(); c1->cd(3); hprof->Draw(); } void htr2() { //connect Tree generated by htw and show histograms for entry 12345 // a variant of htr1 TFile *f = new TFile("ht.root"); TTree *T = (TTree*)f->Get("T"); TCanvas *c1 = new TCanvas("c1","test",10,10,600,1000); c1->Divide(1,3); c1->cd(1); T->Draw("hpx.Draw()","","goff",1,12345); c1->cd(2); T->Draw("hpxpy.Draw()","","goff",1,12345); c1->cd(3); T->Draw("hprof.Draw()","","goff",1,12345); } void htr3() { //connect Tree generated by htw //read all histograms and plot the RMS of hpx versus the Mean of hprof //for each of the 25000 entries TFile *f = new TFile("ht.root"); TTree *T = (TTree*)f->Get("T"); T->Draw("hpx.GetRMS():hprof.GetMean()"); } void htest() { htw(); htr1(); htr2(); htr3(); } htest.C:1 htest.C:2 htest.C:3 htest.C:4 htest.C:5 htest.C:6 htest.C:7 htest.C:8 htest.C:9 htest.C:10 htest.C:11 htest.C:12 htest.C:13 htest.C:14 htest.C:15 htest.C:16 htest.C:17 htest.C:18 htest.C:19 htest.C:20 htest.C:21 htest.C:22 htest.C:23 htest.C:24 htest.C:25 htest.C:26 htest.C:27 htest.C:28 htest.C:29 htest.C:30 htest.C:31 htest.C:32 htest.C:33 htest.C:34 htest.C:35 htest.C:36 htest.C:37 htest.C:38 htest.C:39 htest.C:40 htest.C:41 htest.C:42 htest.C:43 htest.C:44 htest.C:45 htest.C:46 htest.C:47 htest.C:48 htest.C:49 htest.C:50 htest.C:51 htest.C:52 htest.C:53 htest.C:54 htest.C:55 htest.C:56 htest.C:57 htest.C:58 htest.C:59 htest.C:60 htest.C:61 htest.C:62 htest.C:63 htest.C:64 htest.C:65 htest.C:66 htest.C:67 htest.C:68 htest.C:69 htest.C:70 htest.C:71 htest.C:72 htest.C:73 htest.C:74 htest.C:75 htest.C:76 htest.C:77 htest.C:78 htest.C:79 htest.C:80 htest.C:81 htest.C:82 htest.C:83 htest.C:84 htest.C:85 htest.C:86 htest.C:87 |
|