
 Simple example illustrating how to use the C++ interpreter
2 from ROOT
import TCanvas, TH1F, TSlider
3 from ROOT
import gROOT, gBenchmark, gRandom
6 c1 =
TCanvas(
'c1',
'The HSUM example', 200, 10, 600, 400 )
9 gBenchmark.Start(
'hsum' )
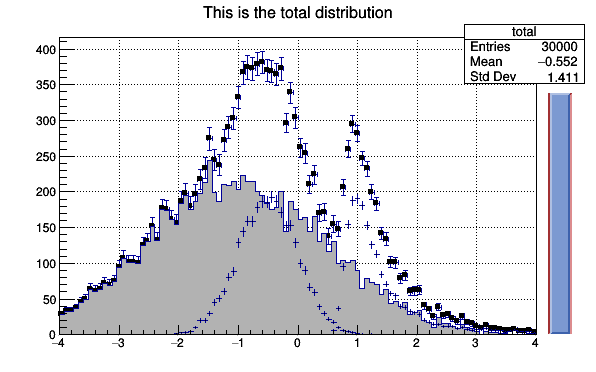
12 total =
TH1F(
'total',
'This is the total distribution', 100, -4, 4 )
13 main =
TH1F(
'main',
'Main contributor', 100, -4, 4 )
14 s1 =
TH1F(
's1',
'This is the first signal', 100, -4, 4 )
15 s2 =
TH1F(
's2',
'This is the second signal', 100, -4, 4 )
19 total.SetMarkerStyle( 21 )
20 total.SetMarkerSize( 0.7 )
21 main.SetFillColor( 16 )
27 gauss, landau = gRandom.Gaus, gRandom.Landau
30 histos = [
'total',
'main',
's1',
's2' ]
32 exec(
'%sFill = %s.Fill' % (name,name))
36 for i
in range( 10000 ):
38 xmain = gauss( -1, 1.5 )
39 xs1 = gauss( -0.5, 0.5 )
40 xs2 = landau( 1, 0.15 )
51 if i
and (i%kUPDATE) == 0 :
58 slider =
TSlider(
'slider',
'test', 4.2, 0, 4.6, total.GetMaximum(), 38 )
59 slider.SetFillColor( 46 )
62 slider.SetRange( 0, float(i) / 10000. )
69 exec(
'del %sFill' % name)
73 slider.SetRange( 0, 1 )
74 total.Draw(
'sameaxis' )
78 gBenchmark.Show(
'hsum' )
- Author
- Wim Lavrijsen
Definition in file hsum.py.

 ROOT 6.07/09 - Reference Guide Generated on Wed Oct 19 2016 02:18:52 using Doxygen 1.8.12.

