Hi Erik,

When sending mails to roottalk, please always specify which version of Root and
which machine ?

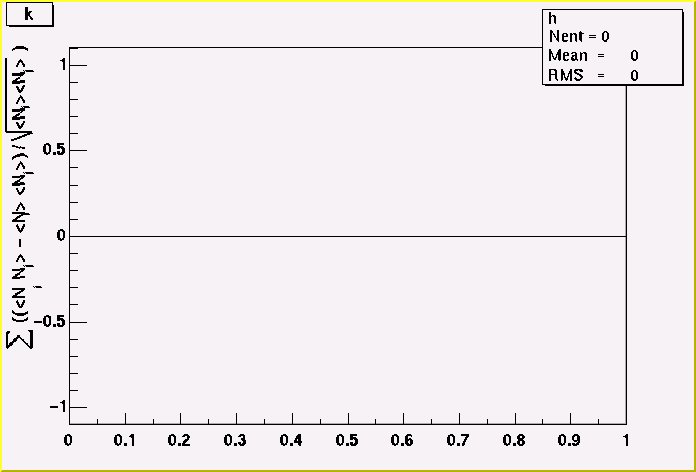
I have no problems with your example. See the output of the following macro
in attachment.

Rene Brun

root [0] TH1F h("h","k",100,0,1)
root [1] h->SetYTitle("#sum ((<N_{i} N_{j}> - <N_{i}> <N_{j}>) /
#sqrt{<N_{i}><N_{j}>} )")
root [2] h.Draw()

Erik Jakobsen wrote:
>
> Hi Everybody
>
> I think I found a problem in ROOT when using the following command from a
> macro:
> Histogram->SetYTitle("#sum ((<N_{i} N_{j}> - <N_{i}> <N_{j}>
> ) / #sqrt{<N_{i}><N_{j}>} )");
>
> Somehow the graph does not come out right on the canvas. I'm not on the
> list, so if you know what might be wrong, contact me at jakobsen@nbi.dk
>
> Thanks,
>
> Erik Jakobsen

This archive was generated by hypermail 2b29 : Tue Jan 01 2002 - 17:50:43 MET