Hi

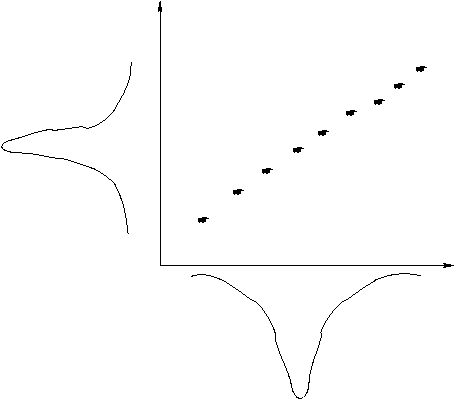
I need to plot a graph (scatter plot) of two variable, let say X and Y
and, along the respective axis, the curve (gaussian) representing the
distribution of each one, so, the curve of Y values must be done rotated
by 90 degrees (something like the attached gif).

I looked for this information on the root web page and on the Users
Guide too and could not find it.

Can someone tell me.

Thanks in advance.

Luiz

This archive was generated by hypermail 2b29 : Tue Jan 01 2002 - 17:51:04 MET