Hi ROOTers.

I have the data which must be displayed in log scale.
The data is like below.

x      y        yerror
1.0   1.5e-11 4.0e-12
2.5   3.0e-12 1.0e-12
4.0   1.7e-12 8.0e-13
7.0   4.0e-13 1.0e-13
10.0  4.0e-15 7.0e-15
30.0  4.0e-14 3.0e-14
60.0  2.0e-16 4.0e-16

As I would like to show data with error bars, I used TGraphErrors.

c1->SetLogx(); c1->SetLogy();
TGraphErrors *gr = new TGraphErrors(ndata, x, y, 0, yerror)
gr->Draw("AP")

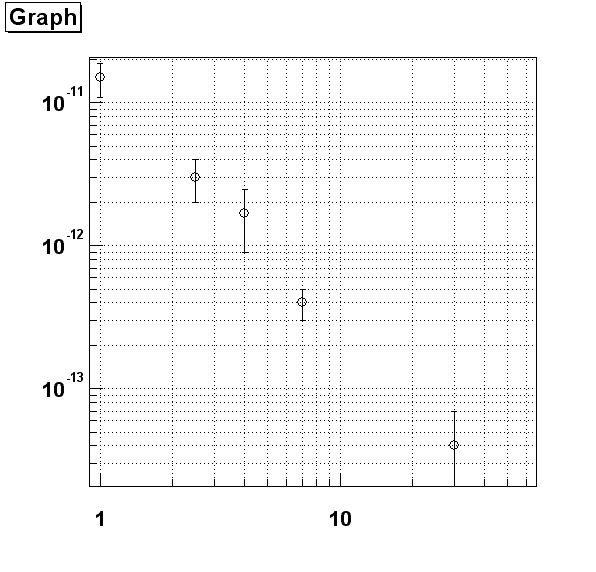
But I could not get all data points with errors.
As I attached this e-mail, the data point with x = 10.0 and 60.0 were not
appeared on graph. Other data points appeared together with errorbars.

I thought that if the values of the data points were smaller than errors,
the data point and the accompanied errors were not drawn.
Is is correct ?

If someone know the method to avoid the my uncomplete result,
Please tell me.
I would like to show all data points with error bars.

I use ROOT v 3.02.06 on IRIX64 and g++ 2.95.2.

Thanks

Harufumi Tsuchiya

This archive was generated by hypermail 2b29 : Tue Jan 01 2002 - 17:51:12 MET