Hi Agnes,

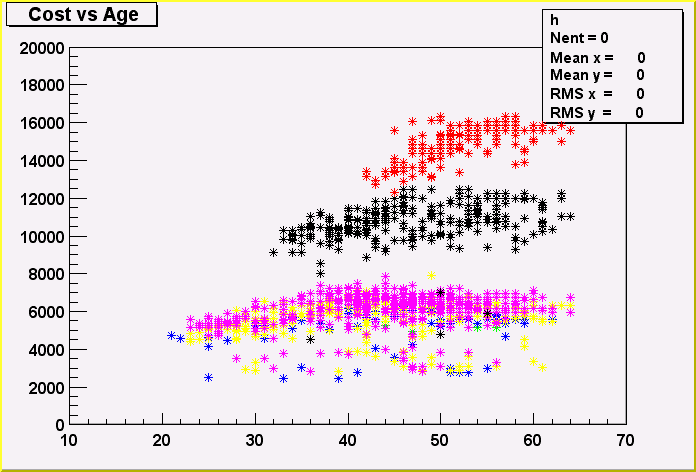
A short example showing how to do what you want. Output gif file is
in the attachement.
You can produce the cernstaff.root file by running the tutorial cernstaff.C
in root 3.02/07

void bigpm() {
   TFile *f = new TFile("cernstaff.root");
   TTree *T = (TTree*)f->Get("T");
   TCanvas *c1 = new TCanvas("c1");
   T->Draw("Cost:Age>>hist","","goff");
   TH2F *h = new TH2F("h","Cost vs Age",60,10,70,20,0,20000);
   h->Draw();
   c1->Update();
   T->SetMarkerStyle(3);
   T->SetMarkerColor(3); T.Draw("Cost:Age","Grade==3","same");
   T->SetMarkerColor(4); T.Draw("Cost:Age","Grade==4","same");
   T->SetMarkerColor(5); T.Draw("Cost:Age","Grade==5","same");
   T->SetMarkerColor(6); T.Draw("Cost:Age","Grade==6","same");
   T->SetMarkerColor(1); T.Draw("Cost:Age","Grade==10","same");
   T->SetMarkerColor(2); T.Draw("Cost:Age","Grade==12","same");
}

Rene Brun

Agnes Lundborg wrote:
>
> Hi
> I have a set of x,y values which each have an assigned z-value. From
> this I would like to get a 2d scatter plot with colored points which are
> pretty big, that is a star or something, not just a dot. The color would
> correspond to the value of z and their position in the 2d scatter plot
> to the x and y values. I absolute do not want different x and y's to
> contribute to the same point which I would get if I use
> profilehistograms or if I do ntuple->Draw("y:x","z");
> How would I do this?
> Agnes

This archive was generated by hypermail 2b29 : Sat Jan 04 2003 - 23:50:39 MET