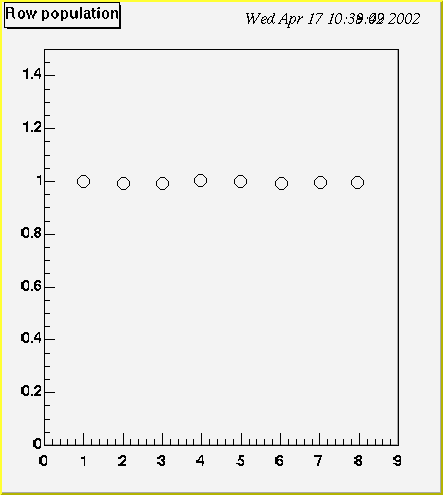
ok It's trivial, I declare the histogram as the following:
hpx    = new TH2F("rowinfo","Row population",100,0,9,100,0,1.5);
Then I do a loop over rownb and fill it as the following:
hpx->Fill(rownb,1);
so for each rownb I have a 1. When I plot it, the points are not on the
same line, there are small variations...
I joined a picture, you'll know what I mean.
Cheers


> Hi,
>
> Please be more specific and give an example.
>
> Rene Brun
>
> Reinhardt Chamonal wrote:
> >
> > Hi,
> > It's me again, but this time I have a problem of alignment..
> > I fill a 2D histogram with a bunch of ones and when I plot it the points
> > are not aligned !?. There are small variations.
> > Any Idea Why ?
> > I am using root  3.01/05...
> >
> > Cheers
> >
> > --
> > ------------------------------------------------------------
> >  Reinhardt CHAMONAL            The University of Edinburgh
> >                                Dept. of Physics & Astronomy
> >  email: chamonal@ph.ed.ac.uk   King's Buildings, JCMB, 5301
> >                                Mayfield Road
> >  phone: +44-131-650 5307       Edinburgh, EH9 3JZ
> >
> >  web: http://www.ph.ed.ac.uk/~chamonal/
> >       http://www.reuh.fr.st
> > ------------------------------------------------------------
>

--
------------------------------------------------------------
 Reinhardt CHAMONAL            The University of Edinburgh
                               Dept. of Physics & Astronomy
 email: chamonal@ph.ed.ac.uk   King's Buildings, JCMB, 5301
                               Mayfield Road
 phone: +44-131-650 5307       Edinburgh, EH9 3JZ

 web: http://www.ph.ed.ac.uk/~chamonal/
      http://www.reuh.fr.st
------------------------------------------------------------
This archive was generated by hypermail 2b29 : Sat Jan 04 2003 - 23:50:50 MET