Hi rootters,

I would have 2 questions:
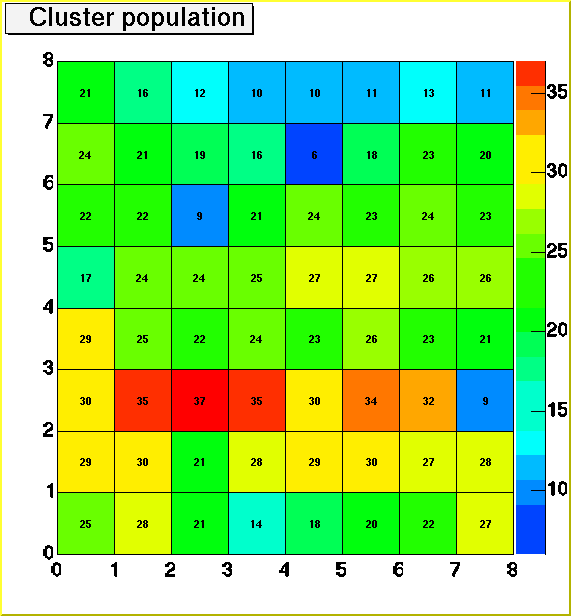
First  I joined a pic of what I have at the moment so that It would be
clear towards what I need..
My first question is concerning the X and Y labelling:
I have a 2D histogram on which I would like to
have the same kind  of labelling than with a 1D histogram, ie the label at
the the center of the bin. How is it best to do it ?

Also the 2D histogram is plotted using the ColZ option to which my second
question is related.  I selected the nice color palette (gradient of blue
to red) but the scale stops at the higher entry value. Is it possible to tell
him to do the gradiant up to 100 instead of 37 in my case ? Because I am
plotting several histograms and I would like to be able to compare them
visually...

Here is also some of my code, just in case:

void clustermap(Int_t runNumber)
{

 c3 = new TCanvas("zdemo","LED Cluster Shower on MAPMT",10,40,400,450);
 c3->Range(0,0,15,16);
 c3->SetFillColor(10);
 Int_t rowline=7;
 Int_t colline=0;
 Float_t tabSignal[64];
 Float_t cluster;
 TFile *f = new TFile(Form("h%d.root",runNumber));
 TTree *t1 = (TTree *)f->Get("population");
 t1->SetBranchAddress("pop",&cluster);
 histo1    = new TH2C("hcluster","Cluster population",8,0,8,8,0,8);
 for (Int_t i=0;i<64;i+=8) //retrieve values
 {
     colline=0;
     for (Int_t j=i;j<=(i+7);j++)
     {
       t1->GetEntry(j);
       hcluster->Fill(colline,rowline,cluster);
       colline++;
     }
     rowline--;

 }
 gStyle->SetPalette(1,0);
 hcluster-> GetYaxis()->SetNdivisions(8);
 hcluster-> GetYaxis()->SetTickLength(1);
 hcluster->SetNdivisions(8);
 hcluster->SetTickLength(1);
 hcluster->SetStats(0);
 hcluster->Draw("colz");
 hcluster->Draw("text:same");

}


Cheers.
Also I would like to thank you all for the great support I had so far.

This archive was generated by hypermail 2b29 : Sat Jan 04 2003 - 23:50:50 MET