Hi,
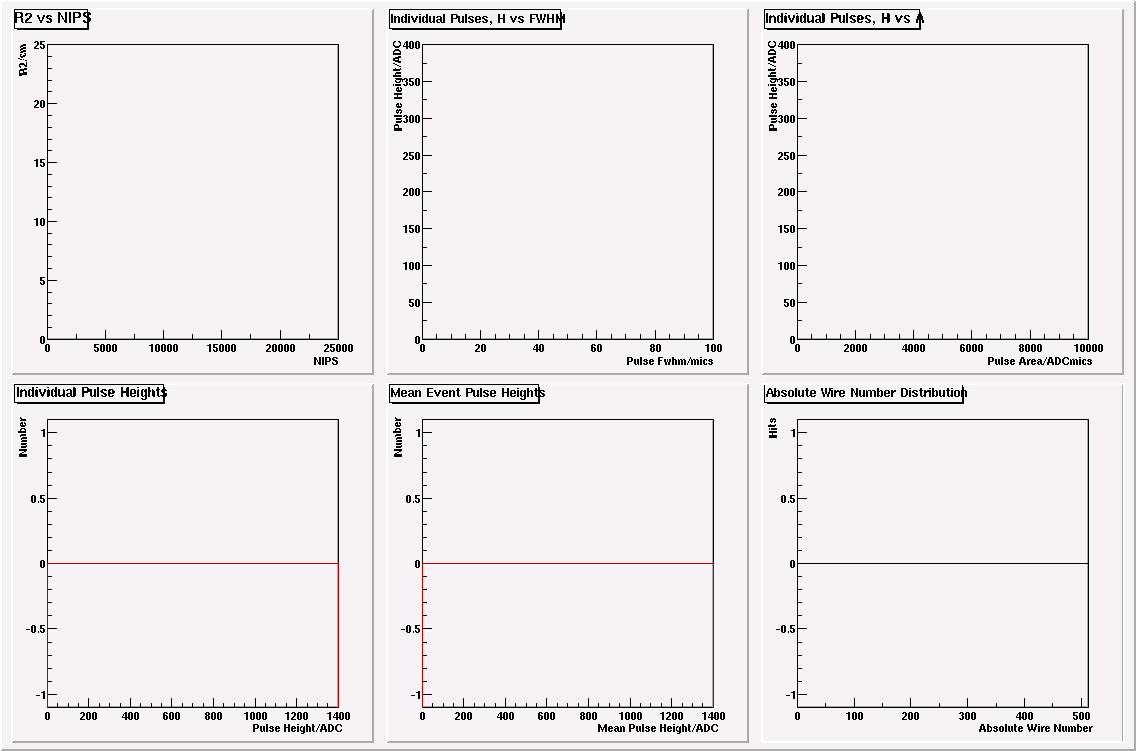
   I've written a small script that plots 6 histograms in 6 pads on a
TCanvas. However, I've noticed that although everything is plotted
correctly, the text in the histogram title TPaveText overshoots the border
of the box, even though it's apparent that the box has been resized to try
and accomodate the text - I've attached a gif file of the canvas to
illustrate  the problem. I have tried modifying title sizes through gStyle
commands, but this only seems to affect the axis titles - and I thought
that drawing the histogram should automatically resize the text box to
accomodate the text. It's only a cosmetic
feature of the plots, but I'd be grateful for any advice on how to solve
this. I'm using ROOT v3.02/07 on a Linux PC with RH7.1. Thanks,

Ben Morgan.

--
-------------------------------------------------------------------------------
Mr. Ben Morgan
Postgraduate Student
University of Sheffield
Department of Physics & Astronomy
Hicks Building
Hounsfield Road
Sheffield  S3 7RH
-------------------------------------------------------------------------------

This archive was generated by hypermail 2b29 : Sat Jan 04 2003 - 23:50:56 MET