Hi,
I have been making a lot of efficiency plots in recent analysis work.
Often these have low statistics and examine threshold behavior, so often
efficiencies are near 0 or 1. I've found it helpful to fit these
distributions with likelihood fits assuming binomial statistics, and
also to plot the histograms with asymmetric errorbars derived from the
binomial distribution and likelihood fit approach.
I am looking for pointers for how to handle this most gracefully in
root. I'm thinking along the lines of making a new class that stores
the necessary information (maybe just pointers to the numerator and
denominator histograms) and defines a Draw() function which creates the
plot using something like TGraphAsymmErrors. But I have little
experience with this, and thought someone on roottalk might have
suggestions on implementing this or have better ideas, or maybe someone
has already done something like this before? Also, how can I best
handle the fitting of these objects?
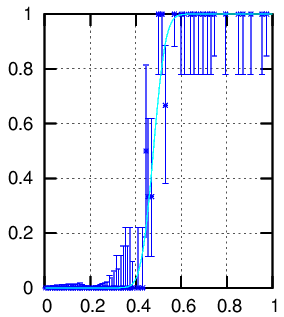
The idea for the errorbars is to place them where -2*log(binomial
dist'n) drops off by one unit from the maximum. (This turns out to be
where nsuc*LOG(r) + (ntry-nsuc)*LOG(1-r) drops by 0.5 units, where r is
the central value ntry/nsuc, nsuc is the numerator histogram bin
content, and ntry is from the denominator histo.) For a Gaussian
distribution, this would be at +/- 1 sigma (symmetric errors), and
represents how far away from the datum a fit would be to contribute one
unit to the total chisquare. So for the binomial fits, these symmetric
errors would carry the same meaning: How far away from a datum would you
go to pick up 1 unit of -2*log(likelihood)? When the observed
efficiency is zero or one, the lower or upper errorbar, respectively,
has zero size but the upper or lower errorbar does not and reflects the
finite statistics. The traditional binomial errorbars assigned by the
Divide function are symmetric approximations of this, and go to zero at
these extremes, where much of my data lie. Attached is an example done
"by hand" (using gnuplot). Here I merged bins as necessary in order to
get at least two counts in the denominator.
Computing these errors requires a simple root-finding algorithm, but
that's not hard since the function is smooth and the accuracy doesn't
need to be more than about one percent. But how to incorporate such an
object into the root framework is not obvious to me.
Thanks,
Topher Cawlfield
This archive was generated by hypermail 2b29 : Thu Jan 01 2004 - 17:50:11 MET