Date: Wed, 2 Mar 2005 13:17:39 +0100
Hi rooters,
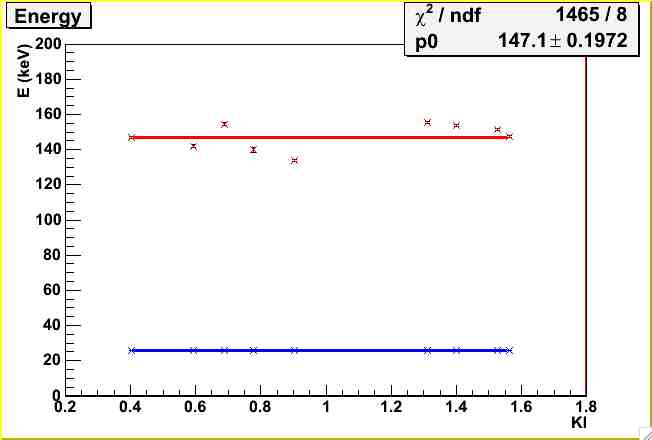
I have a canvas in which I draw 2 graphs using TMultiGraph. I fit these
two graphs with "pol0".
I'd like to print in the Canvas the two boxes with fit parameters but I
get only one (the parameters of the second fit).
How to print the two boxes with fit results ?
root 4.02/00, Mac OS X.3.
Thanks !
Cheers,
Julien
	TCanvas *c2 = new TCanvas("title", "title", 9,44,699,499);
	c2->SetFillColor(kWhite);
	c2->SetFrameFillColor(kWhite);
	TH1F *hfname2 = c2->DrawFrame(0.2, 0, 1.8, 200);
	hfname2->SetTitle("Energy");
	hfname2->SetXTitle("Kl");
hfname2->SetYTitle("E (keV)");
	TGraphErrors *gr2 = new TGraphErrors(9, KL, EN1, 0, ERREN1);
	gr2->SetMarkerStyle(5);
	gr2->SetMarkerColor(kBlue);

	TGraphErrors *gr3 = new TGraphErrors(9, KL, EN2, 0, ERREN2);
	gr3->SetMarkerStyle(5);
	gr3->SetMarkerColor(kRed);

	TMultiGraph *mg = new TMultiGraph();
	mg->Add(gr2);
	mg->Add(gr3);
	mg->Draw("P");

	gr2->Fit("pol0");
	TF1 *fline2 = gr2->GetFunction("pol0");
	fline2->SetLineColor(kBlue);
	gr3->Fit("pol0");
	TF1 *fline3 = gr3->GetFunction("pol0");
	fline3->SetLineColor(kRed);
Received on Wed Mar 02 2005 - 13:18:07 MET