Date: Thu, 4 May 2006 17:03:47 +0300
Dear rooters,
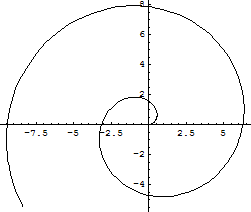
I need to make a 2D graph in polar coordinates,
- for example "r = phi", I try TF1 f1("f1", "x", 0, 10); f1.Draw("COL");
     But it is do not work. Then I read html documentation on TF1 and
     found that TF1 does not support "COL" option.

  2) 1d histogram
       TH1F h1("h1","h1", 100, 0, 6);
       h1.FillRandom("gaus", 10000);
       h1.Draw("POL");

     Also don't work.
So, my question: how I can draw a polar graph like in attached file "x.png"?
--
Best regards,
 Anton                          mailto:anton_roottalk_at_tut.by
Received on Thu May 04 2006 - 16:01:53 MEST