Date: Wed, 10 May 2006 11:16:07 +0200
Hi rooters,
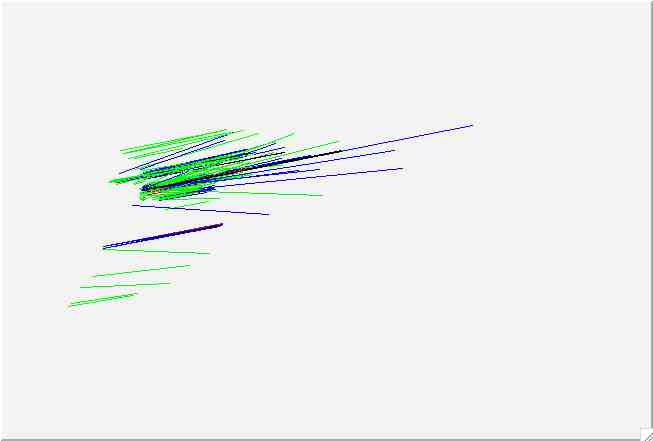
I'd like to draw a hadronic shower developping in the atmosphere in 3D. For this, I use TPolyLine3D to draw each track. My problem is that I can't plot all the shower. For an unknown reason, when I draw the plot, it is cropped. How to solve this problem ? I tried to use TView but the result is not the one I expect. Another problem is that I'd like to have the axis plotted as well and I did not find any solution to do that.
I join the macro I use below and a picture showing the output.
Thanks a lot for your help !
Cheers,
Julien
void plot_3D(TString fname = "pr500z0_0tracks01.had.txt") {
	FILE *fp = fopen(fname.Data(), "r");
	if(fp == NULL) {
		cout << "> File not found!" << endl;
		return;
	} else {cout << "> Input file: " << fname << endl;}


	TCanvas *c1 = new TCanvas(fname.Data(), fname.Data());
// TView *view = new TView(1);
// view->SetRange(-500000,-500000,-500000,500000,500000,500000);
	Int_t PART;
	Double_t X[2], Y[2], Z[2], E;
	TPolyLine3D *pl;

	while(fscanf(fp, "%d. %lf %lf %lf %lf %lf %lf %lf",
									&PART, &X[0], &Y[0], &Z[0], &X[1], &Y[1], &Z[1], &E) == 8) {

		pl = new TPolyLine3D(2, X, Y, Z);

		switch(PART) {
			case  7:  pl->SetLineColor(kRed);
								break;
			case 13:  pl->SetLineColor(kGreen);
								break;
			case 14: 	pl->SetLineColor(kBlue);
								break;
			default:  pl->SetLineColor(kBlack);
								break;
		}


		pl->DrawClone();
		delete pl;

	}


	fclose(fp);
}
Dr. Julien Bolmont
Postdoctoral Researcher - DESY Zeuthen
AMANDA/IceCube