Date: Thu, 16 Aug 2007 13:52:52 +0200
Hi everyone,
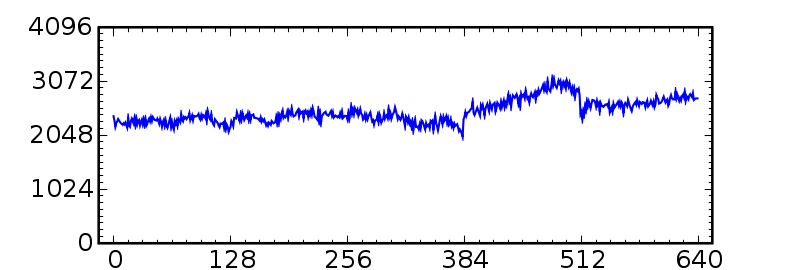
I'm struggling with setting the ticks for a plot. What I'd like to plot is a TGraph with the x-axis going from -16 to 655 with the 5 major ticks being at 0,128,256,384,512,640. I could figure out how to do it in a range from 0 to 640 by setting nDivisions and bins, but not how to deal with the full range. To illustrate what I try to get, I attached an example as png.
Thanks
Markus