Date: Tue, 23 Jun 2009 22:21:36 +0200
I do not see any problem in viewing your data set with the 2 graphs,
running a small modification of your script (see below) to show the
points and lines for both graphs.
see picture in attachment.
Rene Brun
{
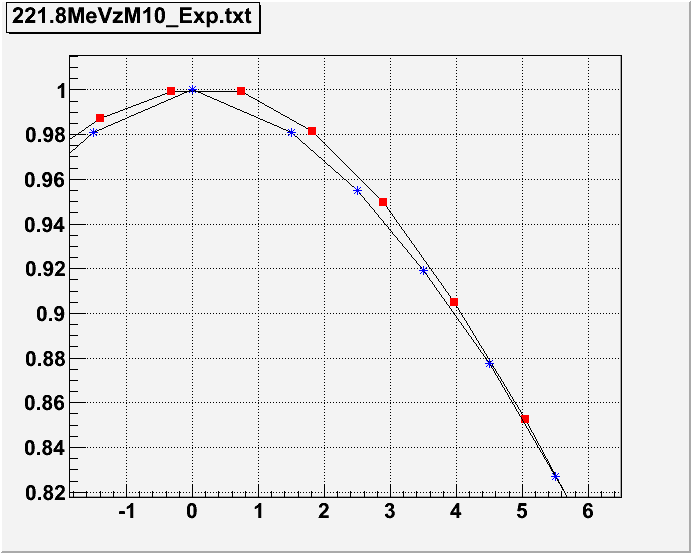
TGraph *gp1 = new TGraph ("221.8MeVzM10_Exp.txt");
TGraph *gp2 = new TGraph ("221.8MeVzM10_MC.txt");
  gp1->SetMarkerStyle(21);
  gp1->SetMarkerColor(kRed);
  gp2->SetMarkerColor(kBlue);
gp1->Draw("alp");
gp2->Draw("lp same*");
}
Perles,Luis A wrote:
> Hello everybody,
>
> I am having problems to display graphics using a line to conect the experimental points in ROOT. Ploting the same data with Grace and ROOT I can see that the line draw to conect points by ROOT is little above the line draw by the Grace. It seems to be a problem with ROOT because others programs like Origin and Excel agree with Grace resulting plot. I am running ROOT 5.22/00a compiled with GCC version 4.3.2 by myself using Gentoo automatic compilation script (portage+emerge) in Linux OS 32 bits. Please, could someone else confirm this problem?
>
> Attached is a script to load some data to reproduce the results. Also, there are two screenshots attached showing what I am seeing.
>
> Cheers,
> Luis A. Perles
> ------------------------------------------------------------------------
>
> ------------------------------------------------------------------------
>