
Level Up Your Histogram Analysis Using ROOT’s UHI
(6 June 2025)What if you could intuitively manipulate your ROOT histograms, create stunning plots with your favorite Python libraries, and perform advanced operations–all with Pythonic ease?
Starting from ROOT 6.36, the Unified Histogram Interface (UHI) bridges the gap between ROOT’s powerful features and Python’s intuitive APIs, taking your data analysis workflow to the next level!
What is UHI?
The Unified Histogram Interface (UHI) is a modern API designed to standardize and simplify histogram operations in Python. Fully implemented now in ROOT, UHI ensures that all ROOT histogram classes–derived from TH1–can leverage a consistent intuitive interface for Python developers, enhanced with a powerful set of functionalities like slicing, indexing, as well as native integration with popular Python plotting libraries, making ROOT histograms more versatile than ever.
How about a quick demo?
Let me show you how you can fill your histograms with NumPy arrays directly:
import matplotlib.pyplot as plt
import mplhep as hep
import numpy as np
import ROOT
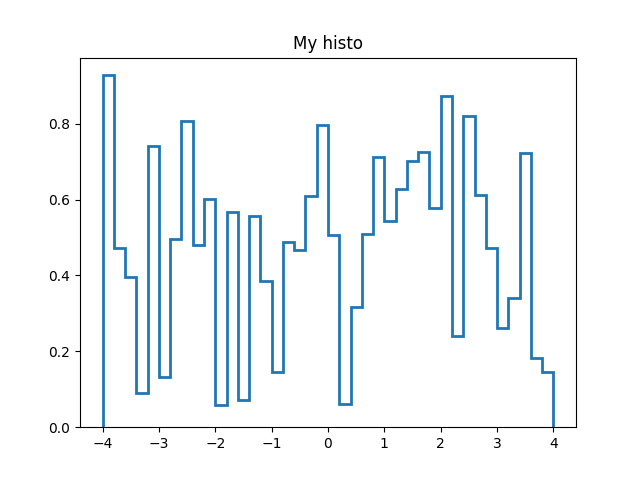
h1 = ROOT.TH1F("h1", "", 40, -4, 4)
h1[...] = np.random.uniform(0, 1, 40)
hep.histplot(h1, label="h1", linewidth=2, yerr=False)
plt.title("My histo")
plt.show()
Et voilà!
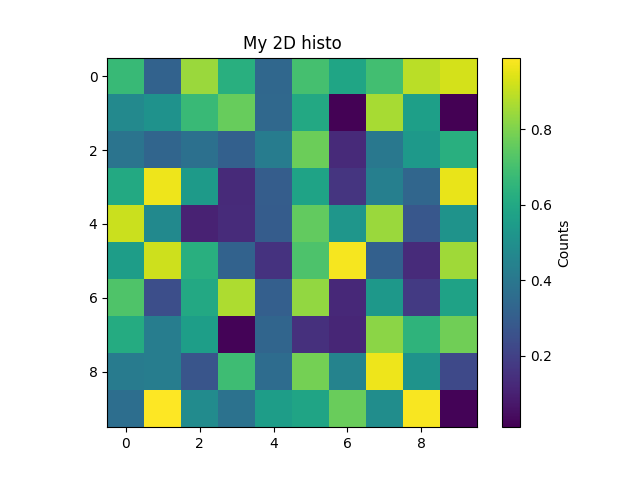
You can also easily plot ROOT histograms with libraries like Matplolib that don’t directly support UHI yet (using a small trick–can you spot it?):
h2 = ROOT.TH2D("h2", "h2", 10, 0, 1, 10, 0, 1)
h2[...] = np.random.uniform(0, 1, (10, 10))

plt.imshow(h2.values())
plt.colorbar(label='Counts')
plt.title("My 2D histo")
plt.show()
Ready to Level Up Your Histogram Analysis?
With UHI, ROOT histograms now offer Python developers an intuitive, modern, and powerful API. Check out the ROOT UHI documentation for more implementation details and examples!