 |
ROOT
Reference Guide |

|
| |
ROOT
Reference Guide |
|


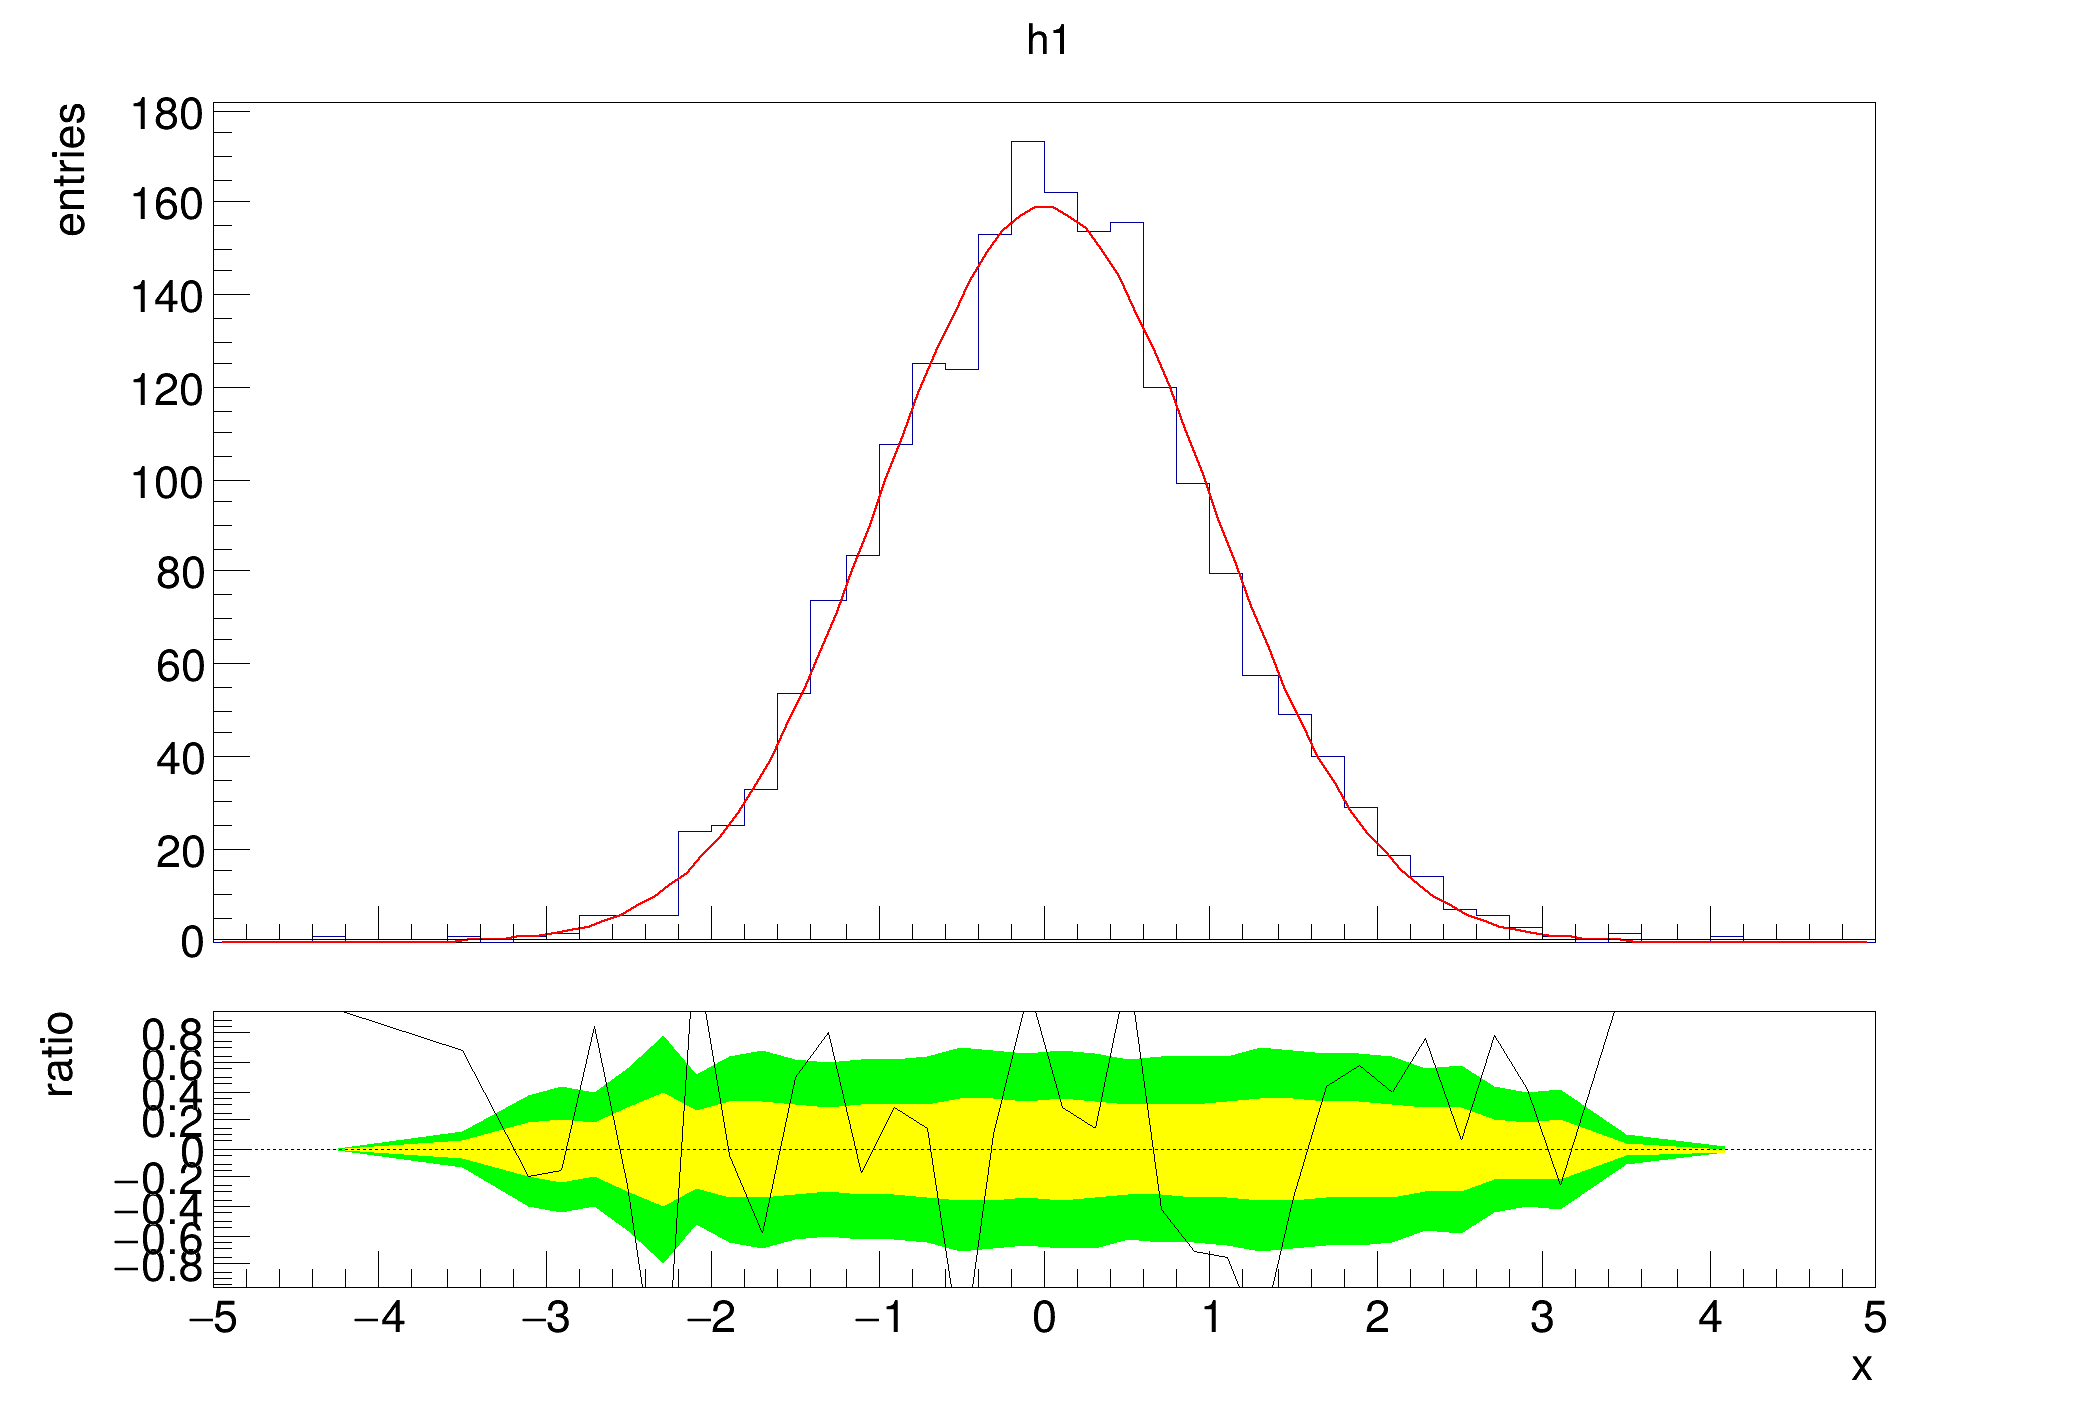 Example of a fit residual plot.
Creates a histogram filled with random numbers from a gaussian distribution and fits it with a standard gaussian function. The result is passed to the TRatioPlot constructor. Additionally, after calling TRatioPlot::Draw the upper and lower y axis titles are modified. Confidence interval bands are automatically drawn on the bottom (but can be disabled by draw option nobands).
Definition in file hist030_TRatioPlot_residual.C.
