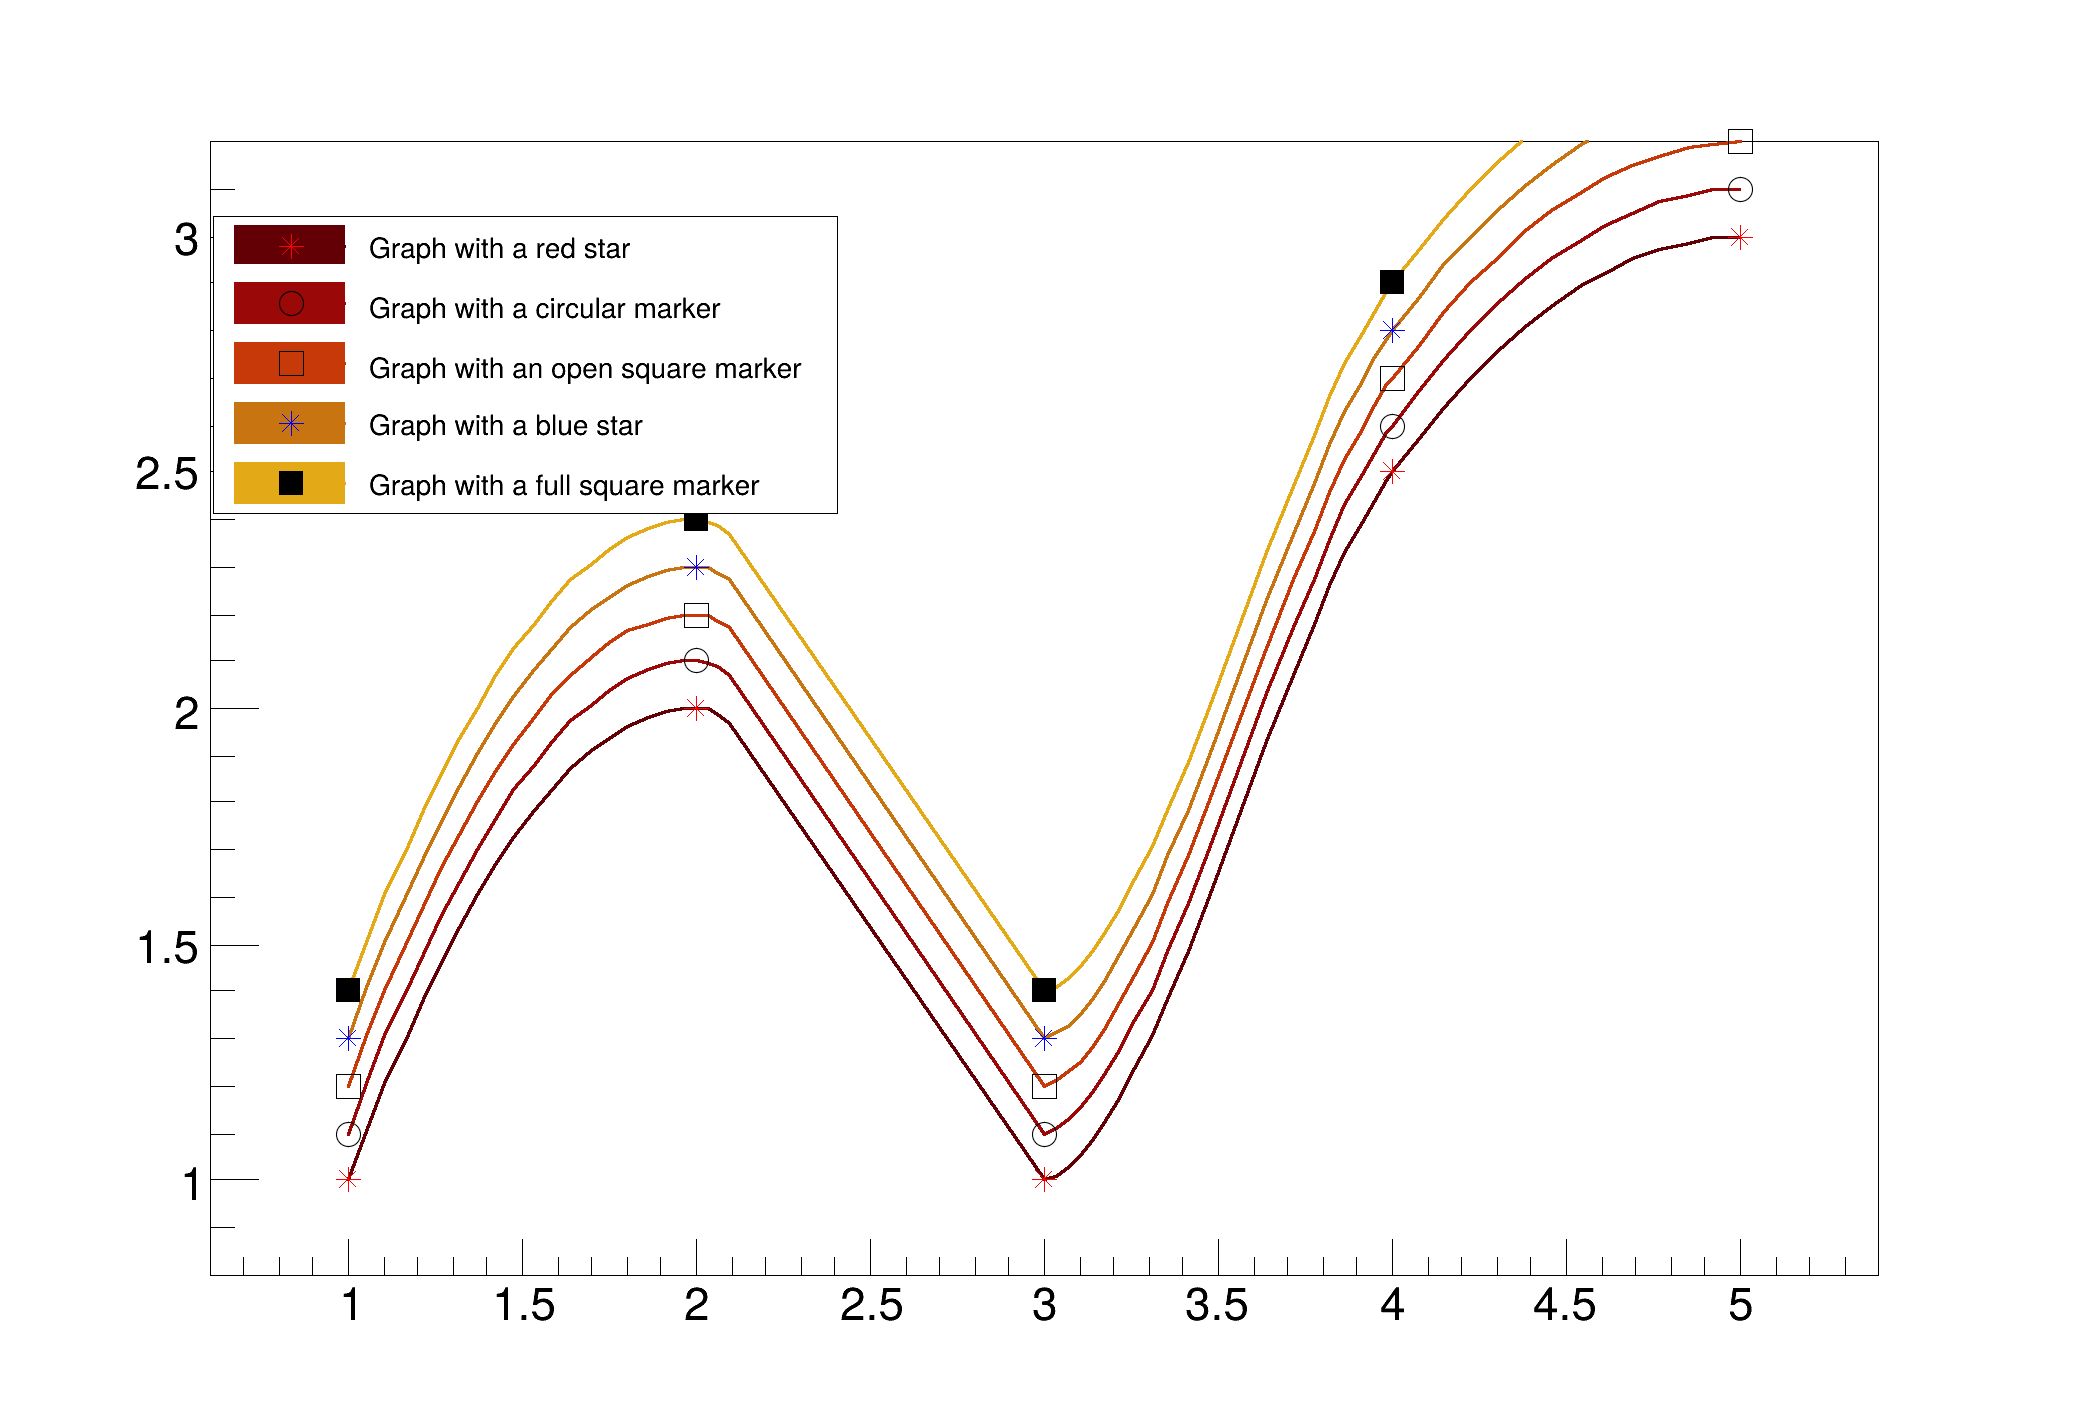
 Palette coloring for graphs is activated thanks to the options PFC (Palette Fill Color), PLC (Palette Line Color) and AMC (Palette Marker Color).
When one of these options is given to TGraph::Draw the TGraph get its color from the current color palette defined by gStyle->SetPalette(...). The color is determined according to the number of objects having palette coloring in the current pad.
In this example five graphs are displayed with palette coloring for lines and and filled area. The graphs are drawn with curves (C option) and one can see the color of each graph is picked inside the palette kSolar. The same is visible on filled polygons in the automatically built legend. To have more control on the legend, it can be created manually, see the graph tutorial gr111_legend.C
void gr104_palettecolor () {
double x[5] = {1,2,3,4,5};
double y1[5] = {1.0,2.0,1.0,2.5,3.0};
double y2[5] = {1.1,2.1,1.1,2.6,3.1};
double y3[5] = {1.2,2.2,1.2,2.7,3.2};
double y4[5] = {1.3,2.3,1.3,2.8,3.3};
double y5[5] = {1.4,2.4,1.4,2.9,3.4};
g1->SetLineWidth(3); g1->SetMarkerColor(
kRed); g2->SetLineWidth(3); g2->SetMarkerStyle(
kCircle);
g1->Draw("CA* PLC PFC");
g2->Draw("PC PLC PFC");
}
Option_t Option_t TPoint TPoint const char y2
Option_t Option_t TPoint TPoint const char y1
virtual void SetLineWidth(Width_t lwidth)
Set the line width.
virtual void SetMarkerColor(Color_t mcolor=1)
Set the marker color.
virtual void SetMarkerStyle(Style_t mstyle=1)
Set the marker style.
void Draw(Option_t *chopt="") override
Default Draw method for all objects.
void SetTitle(const char *title="") override
Set the title of the TNamed.
- Author
- Olivier Couet
Definition in file gr104_palettecolor.C.