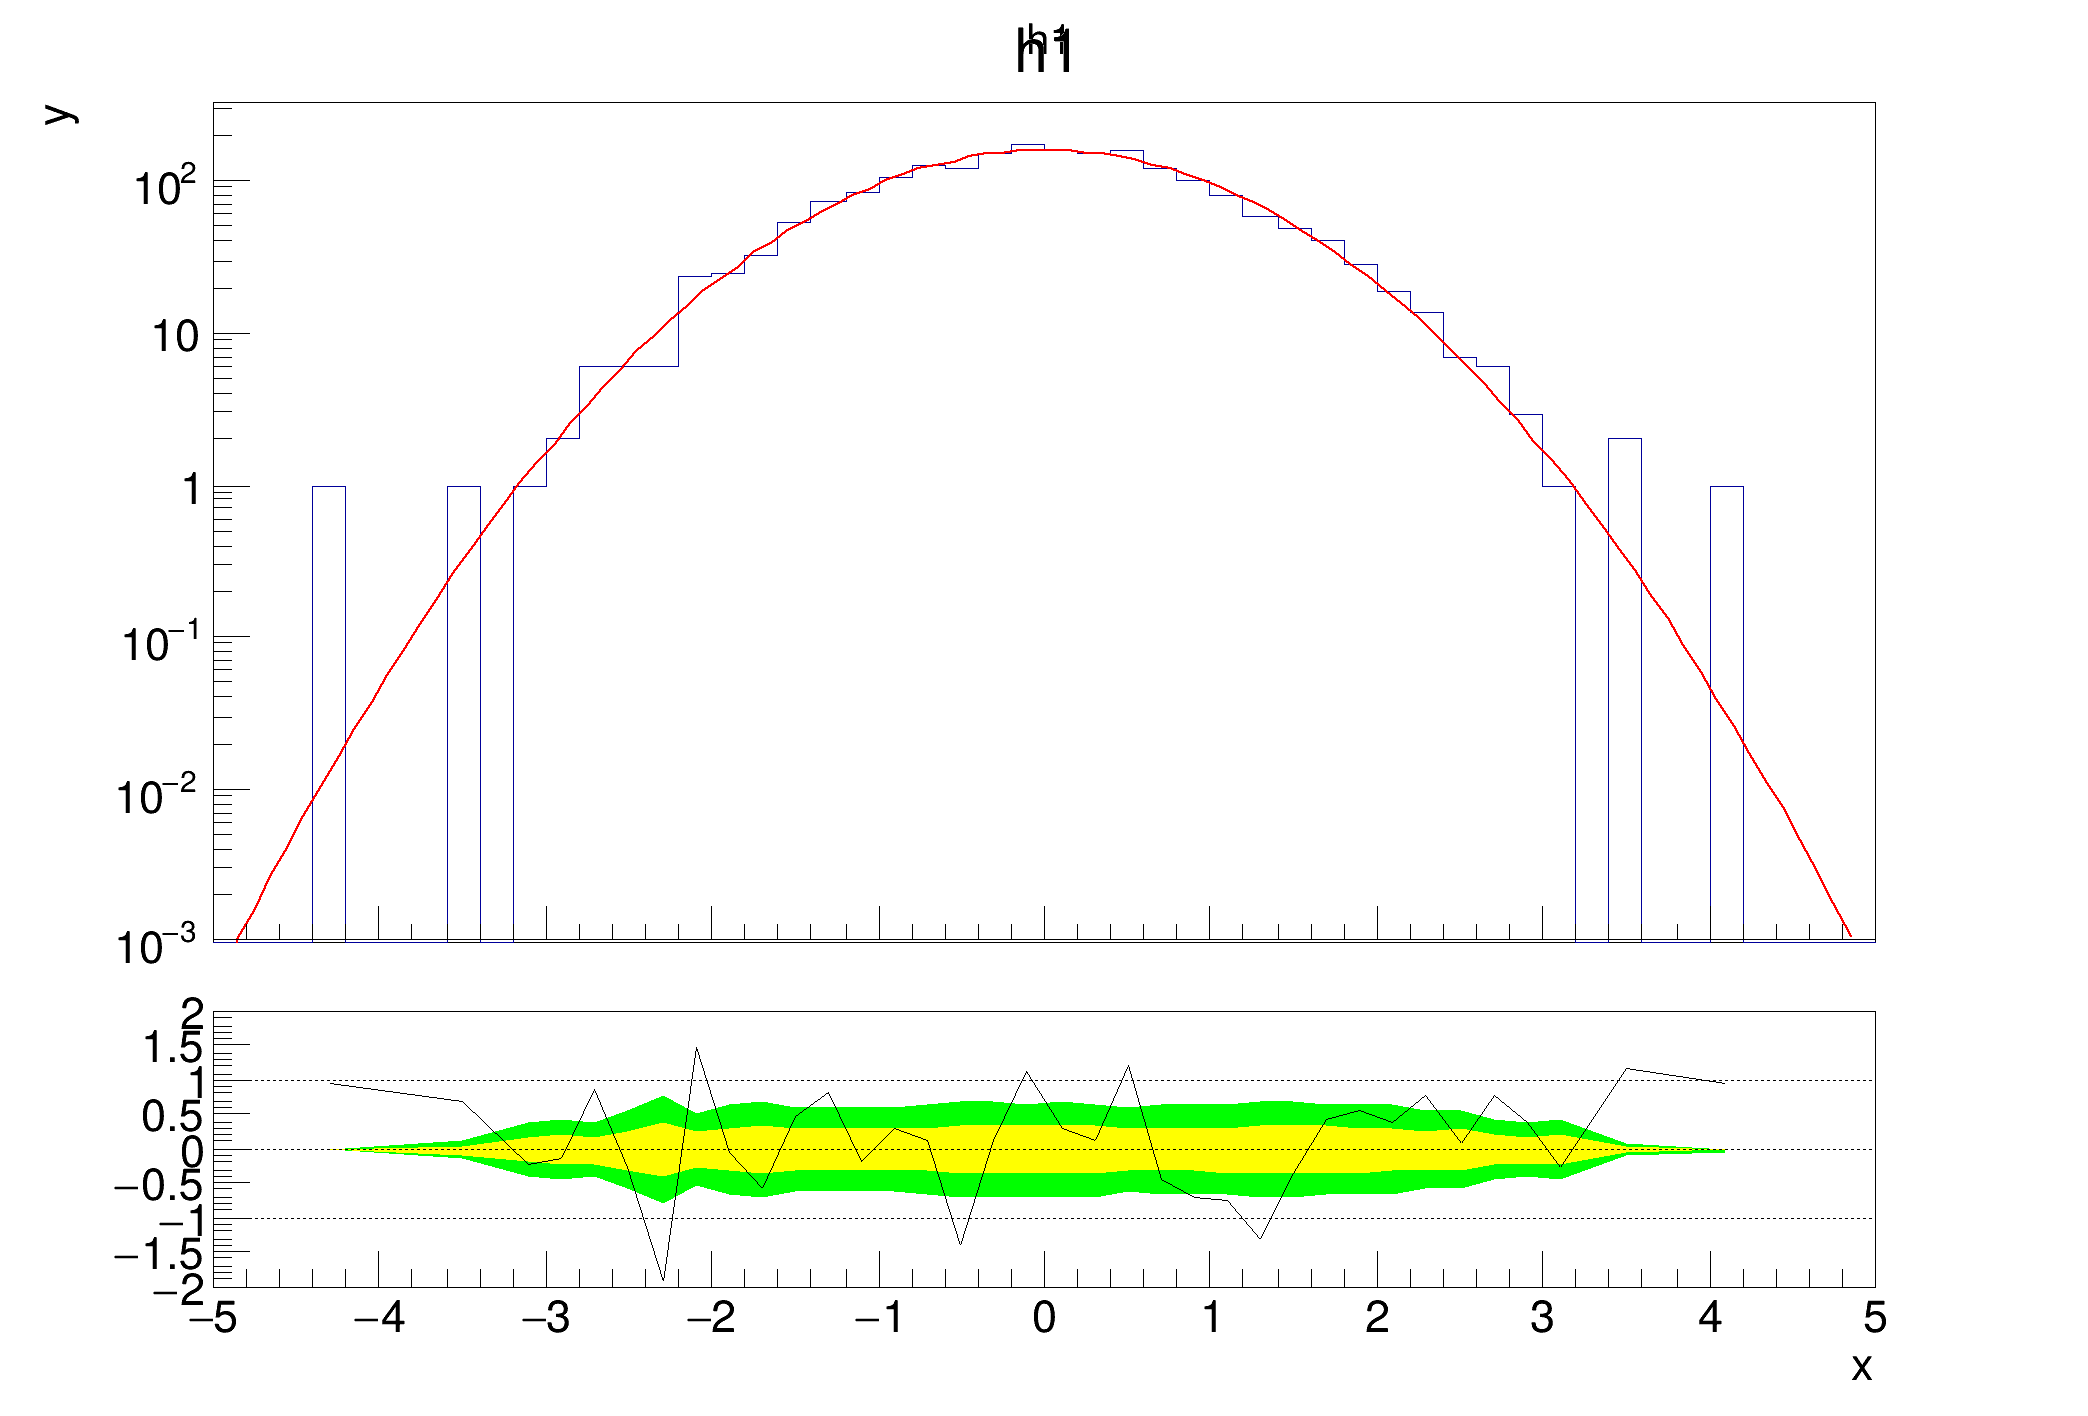
Example which shows how you can get the graph of the lower plot and set the y axis range for it.
Since the lower plot is not created until TRatioPlot.Draw is called, you can only use the method afterwards. Inspired by the tutorial of Paul Gessinger.
import ROOT
ROOT.gStyle.SetOptStat(0)
c1 = ROOT.TCanvas("c1", "fit residual simple")
c1.SetLogy()
h1 = ROOT.TH1D("h1", "h1", 50, -5, 5)
h1.FillRandom("gaus", 2000)
h1.Fit("gaus")
h1.SetMinimum(0.001)
h1.GetXaxis().SetTitle("x")
h1.GetYaxis().SetTitle("y")
rp1 = ROOT.TRatioPlot(h1)
rp1.Draw()
rp1.GetLowerRefGraph().SetMinimum(-2)
rp1.GetLowerRefGraph().SetMaximum(2)
c1.Update()
- Author
- Alberto Ferro
Definition in file hist031_TRatioPlot_residual_fit.py.