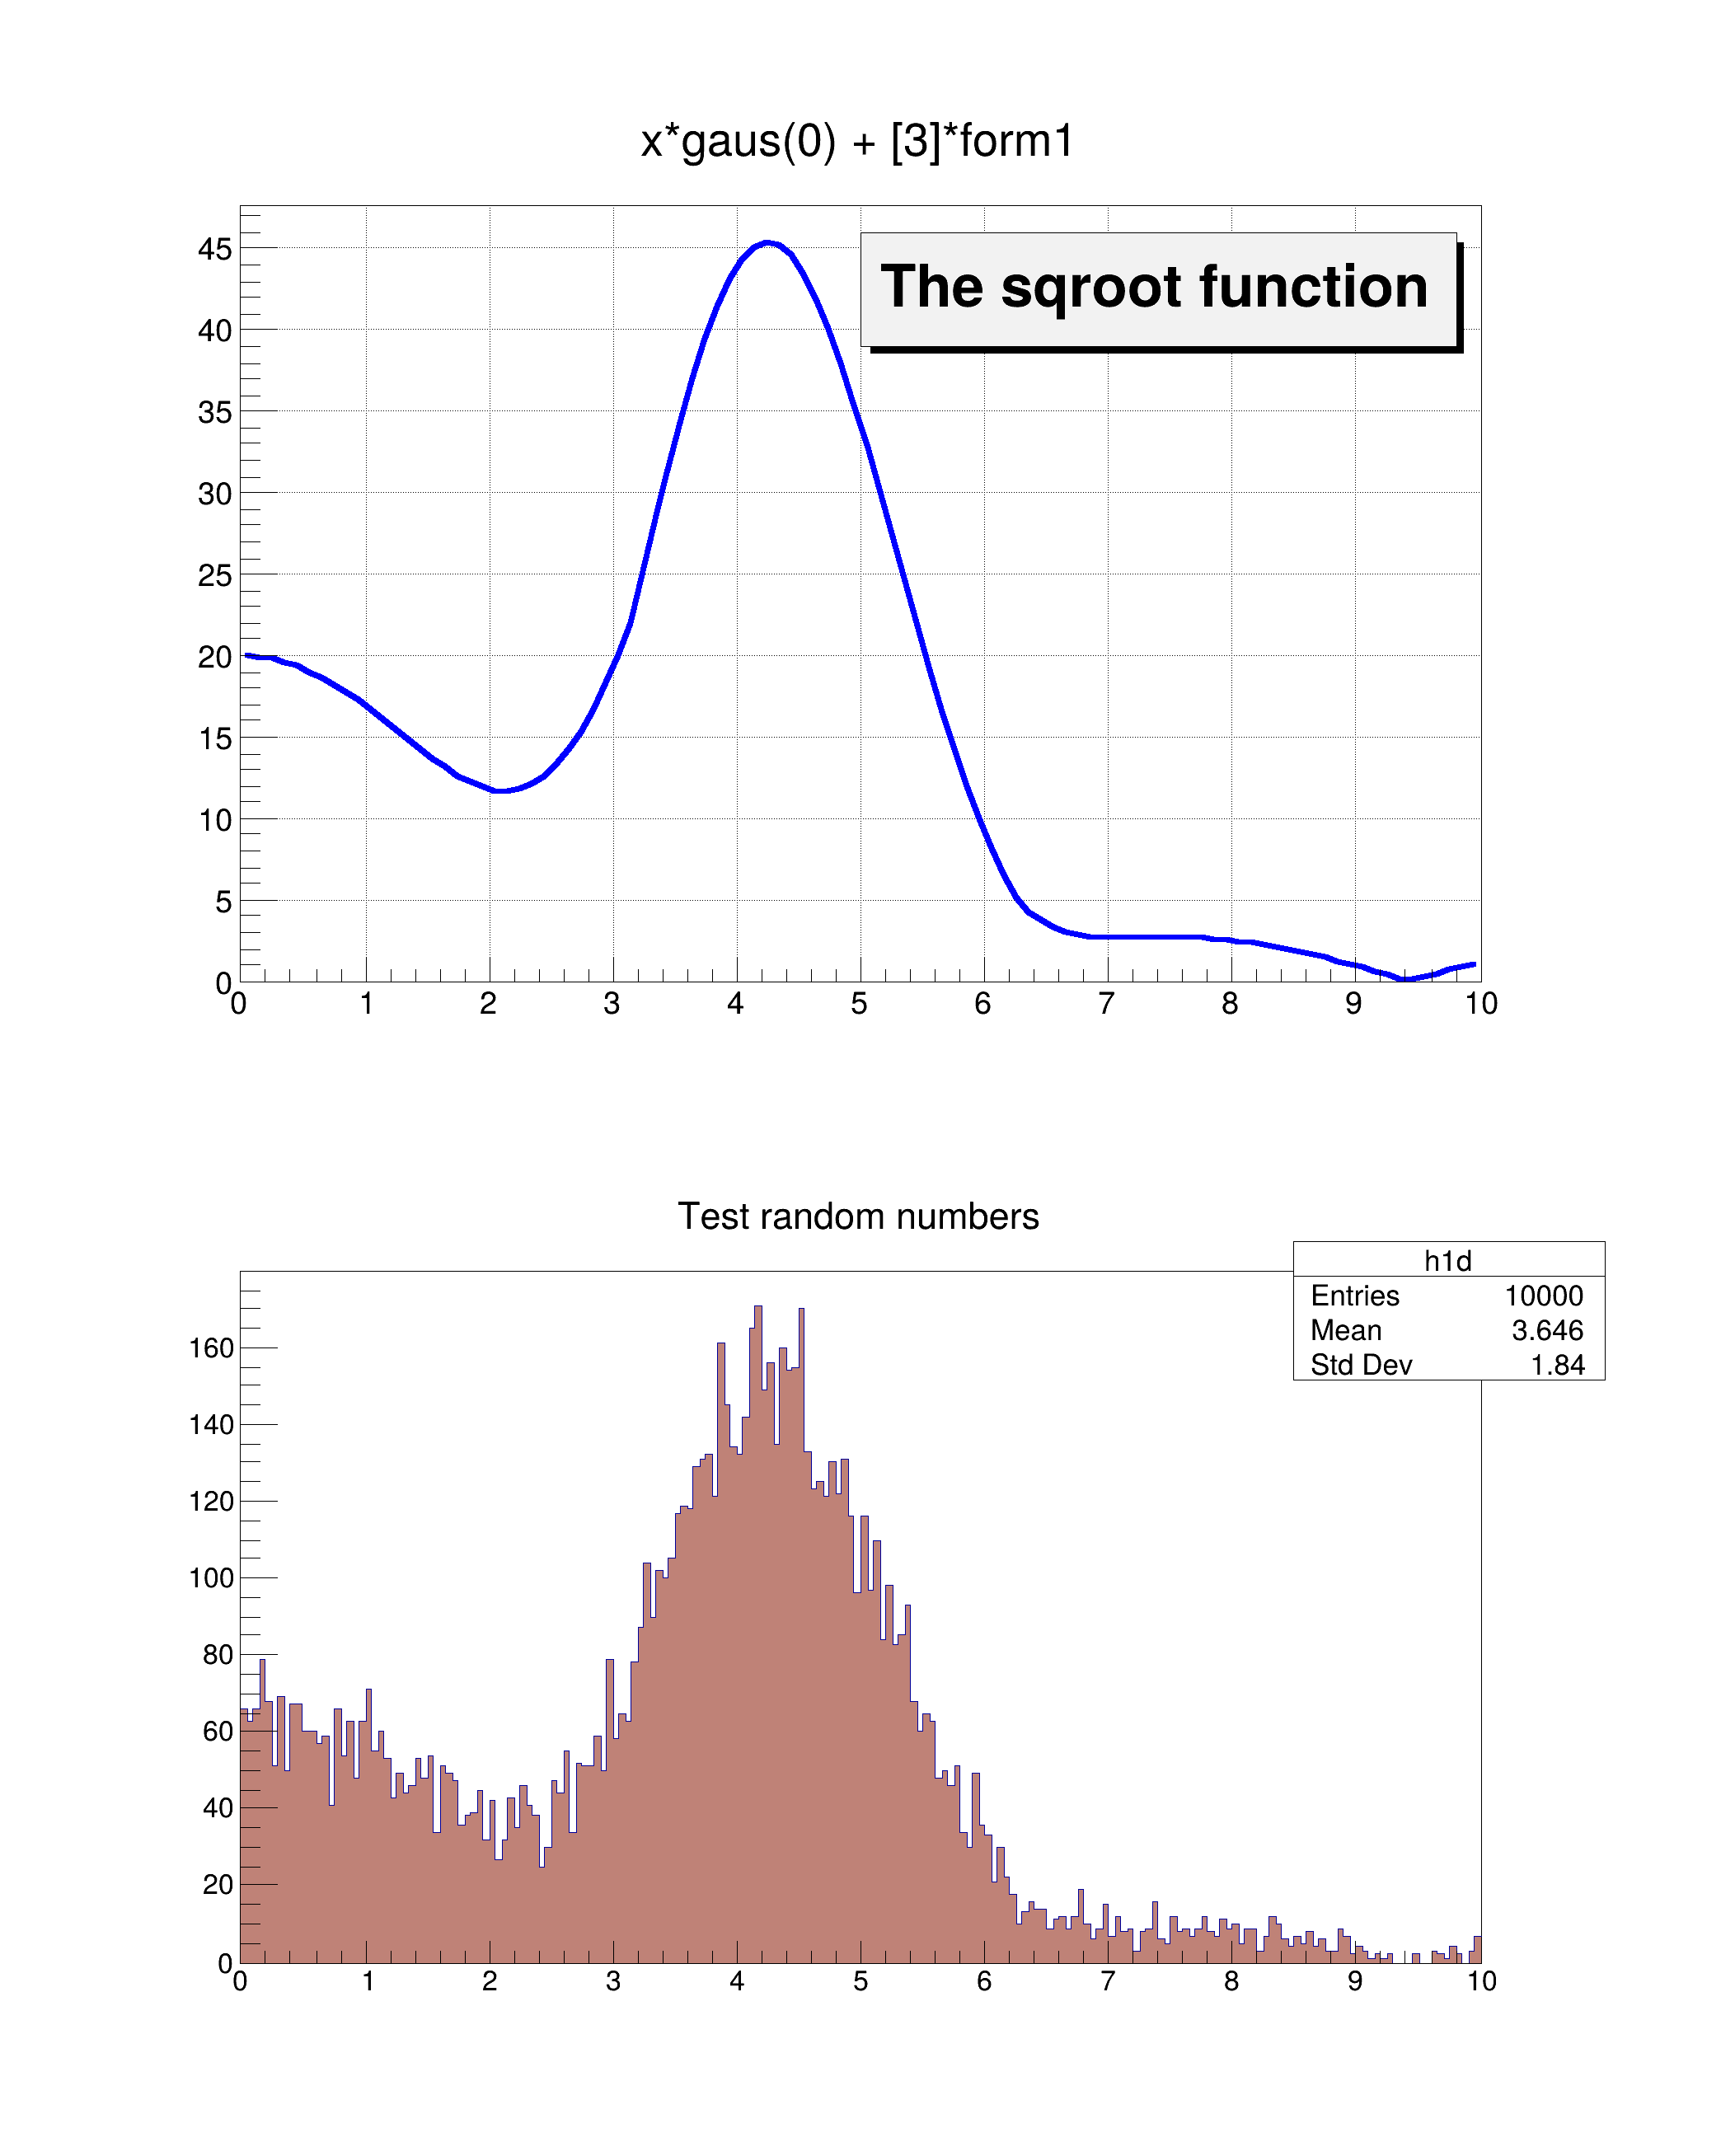
Draw a 1D histogram to a canvas.
- Note
- When using graphics inside a ROOT macro the objects must be created with
new.
import ROOT
rangeMin = 0.0
rangeMax = 10.0
sqroot =
ROOT.TF1(
"sqroot",
"x*gaus(0) + [3]*form1", rangeMin, rangeMax)
nBins = 200
h1d =
ROOT.TH1D(
"h1d",
"Test random numbers", nBins, rangeMin, rangeMax)
topX = 200
topY = 10
width = 700
height = 900
c1 =
ROOT.TCanvas(
"c1",
"The FillRandom example", topX, topY, width, height)
pad1 =
ROOT.TPad(
"pad1",
"The pad with the function", 0.05, 0.50, 0.95, 0.95)
pad2 =
ROOT.TPad(
"pad2",
"The pad with the histogram", 0.05, 0.05, 0.95, 0.45)
ROOT::Detail::TRangeCast< T, true > TRangeDynCast
TRangeDynCast is an adapter class that allows the typed iteration through a TCollection.
- Date
- November 2024
- Author
- Rene Brun, Giacomo Parolini
Definition in file hist003_TH1_draw.py.