Logo ROOT  
Reference Guide
 
Loading...
Searching...
No Matches
ratioplot6.py File Reference

Detailed Description

View in nbviewer Open in SWAN
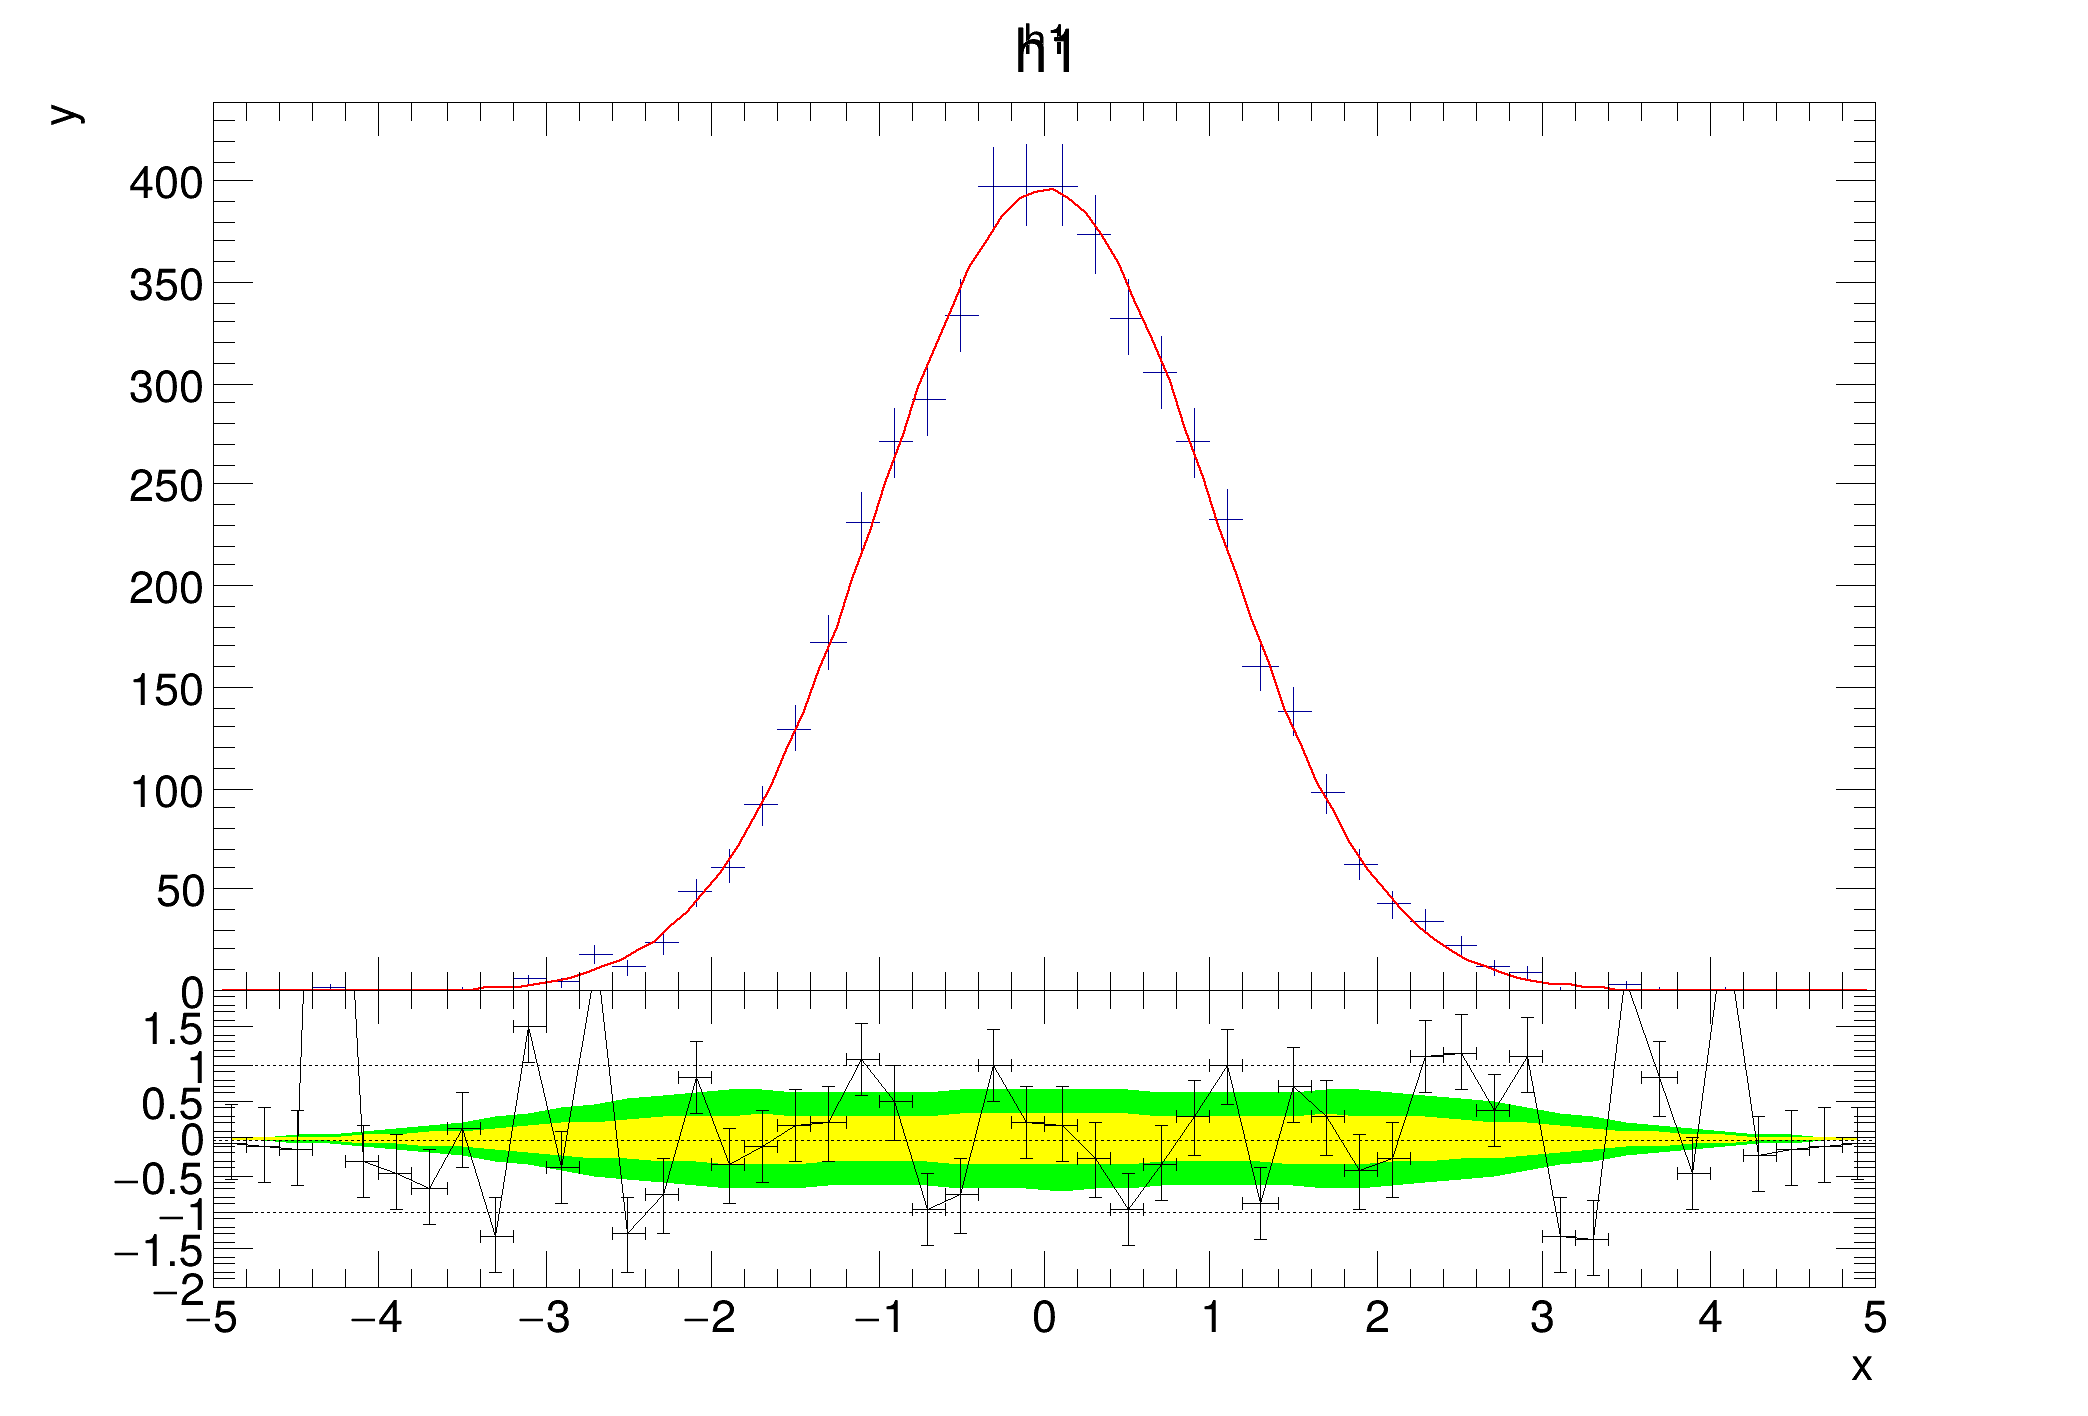
Example showing a fit residual plot, where the separation margin has been set to 0.

The last label of the lower plot's y axis is hidden automatically. Inspired by the tutorial of Paul Gessinger.

import ROOT
ROOT.gStyle.SetOptStat(0)
c1 = ROOT.TCanvas("c1", "fit residual simple")
ROOT.gPad.SetFrameFillStyle(0)
h1 = ROOT.TH1D("h1", "h1", 50, -5, 5)
h1.FillRandom("gaus", 5000)
h1.Fit("gaus", "S")
h1.Sumw2()
h1.GetXaxis().SetTitle("x")
h1.GetYaxis().SetTitle("y")
rp1 = ROOT.TRatioPlot(h1, "errfunc")
rp1.SetGraphDrawOpt("L")
rp1.SetSeparationMargin(0.0)
rp1.Draw()
rp1.GetLowerRefGraph().SetMinimum(-2)
rp1.GetLowerRefGraph().SetMaximum(2)
c1.Update()
Author
Alberto Ferro

Definition in file ratioplot6.py.