Multidimensional models: projecting pdf and data ranges in continuous observables
import ROOT
frame =
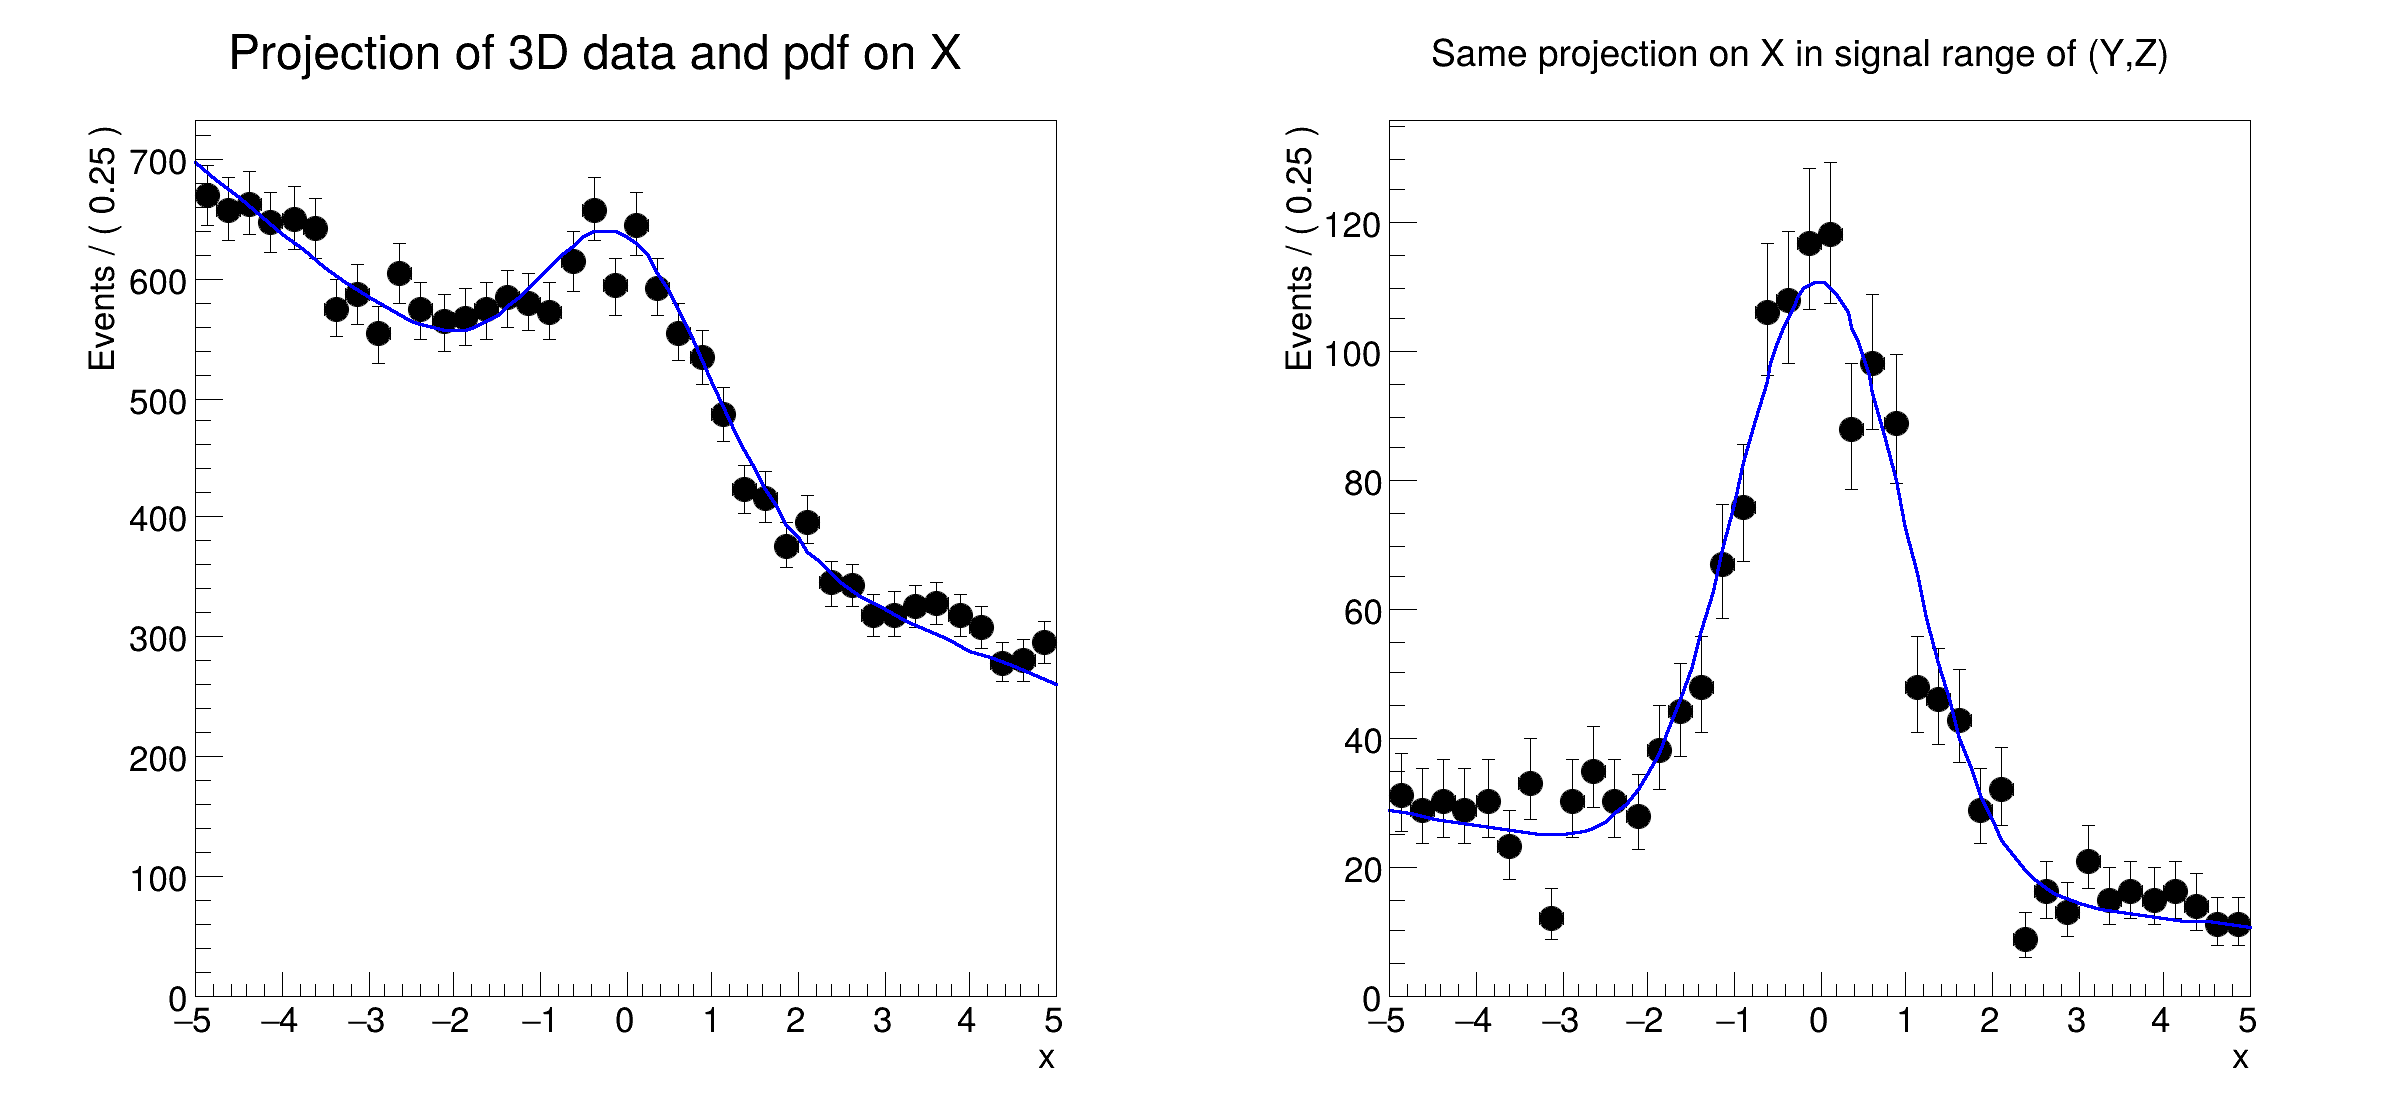
x.frame(Title=
"Projection of 3D data and pdf on X", Bins=40)
frame2 =
x.frame(Title=
"Same projection on X in signal range of (Y,Z)", Bins=40)
c =
ROOT.TCanvas(
"rf311_rangeplot",
"rf310_rangeplot", 800, 400)
ROOT::Detail::TRangeCast< T, true > TRangeDynCast
TRangeDynCast is an adapter class that allows the typed iteration through a TCollection.
[#1] INFO:Plotting -- RooAbsReal::plotOn(model) plot on x integrates over variables (y,z)
[#1] INFO:Eval -- RooRealVar::setRange(y) new range named 'sigRegion' created with bounds [-1,1]
[#1] INFO:Eval -- RooRealVar::setRange(z) new range named 'sigRegion' created with bounds [-1,1]
[#1] INFO:Plotting -- RooTreeData::plotOn: plotting 1692 events out of 20000 total events
[#1] INFO:Plotting -- RooAbsReal::plotOn(model) plot on x integrates over variables (y,z) in range sigRegion
- Date
- February 2018
- Authors
- Clemens Lange, Wouter Verkerke (C++ version)
Definition in file rf311_rangeplot.py.