ROOT  6.07/01
Reference Guide
 All Classes Namespaces Files Functions Variables Typedefs Enumerations Enumerator Properties Friends Macros Groups Pages
logscales.C File Reference

Draw parametric functions with log scales. More...

Go to the source code of this file.

Detailed Description

Draw parametric functions with log scales.
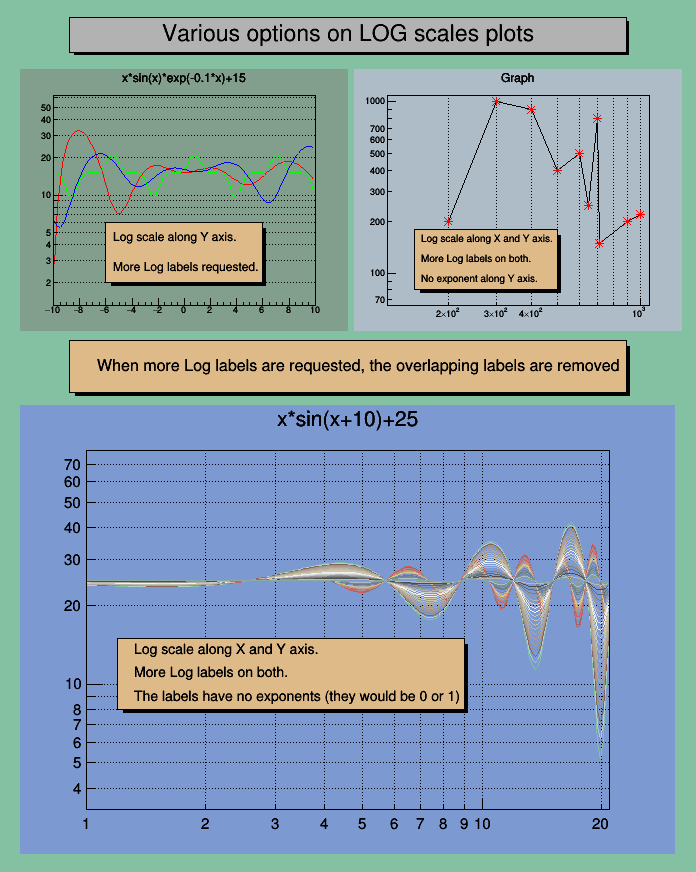
pict1_logscales.C.png
void logscales() {
TCanvas *c1 = new TCanvas("c1", "Various options on LOG scales plots",0,0,700,900);
c1->SetFillColor(30);
TPad *pad1 = new TPad("pad1","pad1",0.03,0.62,0.50,0.92,32);
TPad *pad2 = new TPad("pad2","pad2",0.51,0.62,0.98,0.92,33);
TPad *pad3 = new TPad("pad3","pad3",0.03,0.02,0.97,0.535,38);
pad1->Draw(); pad2->Draw(); pad3->Draw();
TPaveLabel *title = new TPaveLabel(0.1,0.94,0.9,0.98, "Various options on LOG scales plots");
title->SetFillColor(16);
title->SetTextFont(42);
title->Draw();
TPaveText *pave = new TPaveText(0.1,0.55,0.9,0.61);
pave->SetFillColor(42);
pave->SetTextAlign(12);
pave->SetTextFont(42);
pave->AddText("When more Log labels are requested, the overlapping labels are removed");
pave->Draw();
pad1->cd();
pad1->SetLogy();
pad1->SetGridy();
TF1 *f1 = new TF1("f1","x*sin(x)*exp(-0.1*x)+15",-10.,10.);
TF1 *f2 = new TF1("f2","(sin(x)+cos(x))**5+15",-10.,10.);
TF1 *f3 = new TF1("f3","(sin(x)/(x)-x*cos(x))+15",-10.,10.);
f1->SetLineWidth(1); f1->SetLineColor(2);
f2->SetLineWidth(1); f2->SetLineColor(3);
f3->SetLineWidth(1); f3->SetLineColor(4);
f1->Draw();
f2->Draw("same");
f3->Draw("same");
TPaveText *pave1 = new TPaveText(-6,2,6,6);
pave1->SetFillColor(42);
pave1->SetTextAlign(12);
pave1->SetTextFont(42);
pave1->AddText("Log scale along Y axis.");
pave1->AddText("More Log labels requested.");
pave1->Draw();
pad2->cd();
double x[10] = { 200, 300, 400, 500, 600, 650, 700, 710, 900,1000 };
double y[10] = { 200, 1000, 900, 400, 500, 250, 800, 150, 201, 220 };
TGraph *g_2 = new TGraph(10,x,y);
g_2->Draw("AL*");
g_2->SetMarkerColor(2);
pad2->SetLogy();
pad2->SetLogx();
pad2->SetGridx();
TPaveText *pave2 = new TPaveText(150,80,500,180);
pave2->SetFillColor(42);
pave2->SetTextFont(42);
pave2->SetTextAlign(12);
pave2->AddText("Log scale along X and Y axis.");
pave2->AddText("More Log labels on both.");
pave2->AddText("No exponent along Y axis.");
pave2->Draw();
pad3->cd();
pad3->SetGridx();
pad3->SetGridy();
pad3->SetLogy();
pad3->SetLogx();
TF1 *f4 = new TF1("f4a","x*sin(x+10)+25",1,21);
f4->SetLineWidth(1);
f4->Draw();
f4->SetNpx(200);
f4 = new TF1("f4b","x*cos(x+10)*sin(x+10)+25",1,21);
f4->SetLineWidth(1); f4->Draw("same");
f4->SetNpx(200);
Int_t a = 20;
for (int i=a; i>=1; i--) {
f4 = new TF1(Form("f4b_%d",i),"x*sin(x+10)*[0]/[1]+25",1,21);
f4->SetParameter(0,i);
f4->SetParameter(1,a);
f4->SetNpx(200);
f4->SetLineWidth(1); f4->SetLineColor(i+10);
f4->Draw("same");
f4 = new TF1(Form("f4c_%d",i),"x*cos(x+10)*sin(x+10)*[0]/[1]+25",1,25);
f4->SetParameter(0,i);
f4->SetParameter(1,a);
f4->SetNpx(200);
f4->SetLineWidth(1); f4->SetLineColor(i+30); f4->Draw("same");
}
TPaveText *pave3 = new TPaveText(1.2,8,9,15);
pave3->SetFillColor(42);
pave3->AddText("Log scale along X and Y axis.");
pave3->SetTextFont(42);
pave3->SetTextAlign(12);
pave3->AddText("More Log labels on both.");
pave3->AddText("The labels have no exponents (they would be 0 or 1)");
pave3->Draw();
}
Author
Olivier Couet

Definition in file logscales.C.