ROOT  6.07/01
Reference Guide
 All Classes Namespaces Files Functions Variables Typedefs Enumerations Enumerator Properties Friends Macros Groups Pages
zdemo.C File Reference

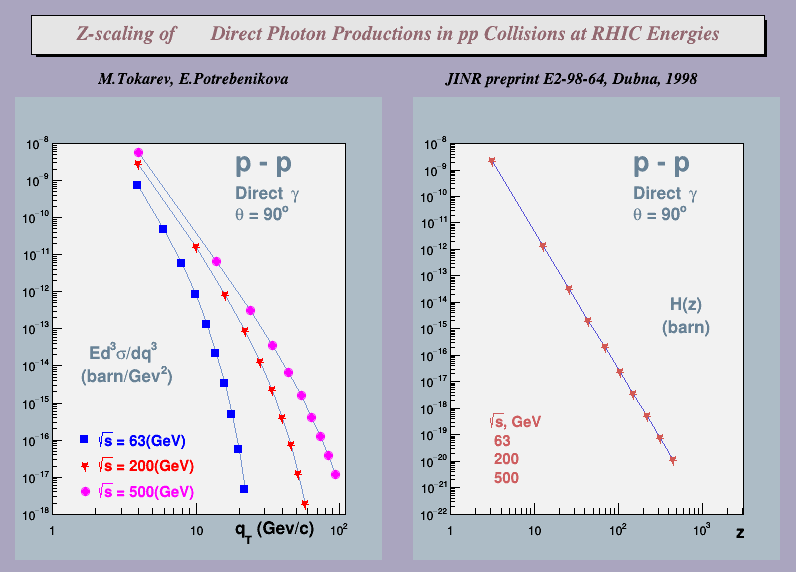
This macro is an example of graphs in log scales with annotations. More...

Go to the source code of this file.

Detailed Description

This macro is an example of graphs in log scales with annotations.

The presented results are predictions of invariant cross-section of Direct Photons produced at RHIC energies, based on the universality of scaling function H(z).

These Figures were published in JINR preprint E2-98-64, Dubna, 1998 and submitted to CPC.

Note that the way greek symbols, super/subscripts are obtained illustrate the current limitations of Root in this area.

pict1_zdemo.C.png
#include "TCanvas.h"
#include "TPad.h"
#include "TPaveLabel.h"
#include "TLatex.h"
#include "TGraph.h"
#include "TFrame.h"
const Int_t NMAX = 20;
//__________________________________________________________________
void zdemo()
{
Float_t energ;
Float_t dens;
Float_t tgrad;
Float_t ptmin;
Float_t ptmax;
Float_t delp;
// Create a new canvas.
TCanvas *c1 = new TCanvas("zdemo",
"Monte Carlo Study of Z scaling",10,40,800,600);
c1->Range(0,0,25,18);
c1->SetFillColor(40);
TPaveLabel *pl = new TPaveLabel(1,16.3,24,17.5,"Z-scaling of \
Direct Photon Productions in pp Collisions at RHIC Energies","br");
pl->SetFillColor(18);
pl->SetTextFont(32);
pl->SetTextColor(49);
pl->Draw();
TLatex *t = new TLatex();
t->SetTextFont(32);
t->SetTextColor(1);
t->SetTextSize(0.03);
t->SetTextAlign(12);
t->DrawLatex(3.1,15.5,"M.Tokarev, E.Potrebenikova ");
t->DrawLatex(14.,15.5,"JINR preprint E2-98-64, Dubna, 1998 ");
TPad *pad1 = new TPad("pad1","This is pad1",0.02,0.02,0.48,0.83,33);
TPad *pad2 = new TPad("pad2","This is pad2",0.52,0.02,0.98,0.83,33);
pad1->Draw();
pad2->Draw();
//
// Cross-section of direct photon production in pp collisions
// at 500 GeV vs Pt
//
energ = 63;
dens = 1.766;
tgrad = 90.;
ptmin = 4.;
ptmax = 24.;
delp = 2.;
hz_calc(energ, dens, tgrad, ptmin, ptmax, delp);
pad1->cd();
pad1->Range(-0.255174,-19.25,2.29657,-6.75);
pad1->SetLogx();
pad1->SetLogy();
// create a 2-d histogram to define the range
pad1->DrawFrame(1,1e-18,110,1e-8);
pad1->GetFrame()->SetFillColor(19);
t = new TLatex();
t->SetNDC();
t->SetTextFont(62);
t->SetTextColor(36);
t->SetTextSize(0.08);
t->SetTextAlign(12);
t->DrawLatex(0.6,0.85,"p - p");
t->SetTextSize(0.05);
t->DrawLatex(0.6,0.79,"Direct #gamma");
t->DrawLatex(0.6,0.75,"#theta = 90^{o}");
t->DrawLatex(0.20,0.45,"Ed^{3}#sigma/dq^{3}");
t->DrawLatex(0.18,0.40,"(barn/Gev^{2})");
t->SetTextSize(0.045);
t->DrawLatex(0.22,0.260,"#sqrt{s} = 63(GeV)");
t->DrawLatex(0.22,0.205,"#sqrt{s} = 200(GeV)");
t->SetTextColor(6);
t->DrawLatex(0.22,0.15,"#sqrt{s} = 500(GeV)");
t->SetTextSize(0.05);
t->SetTextColor(1);
t->DrawLatex(0.6,0.06,"q_{T} (Gev/c)");
TGraph *gr1 = new TGraph(NLOOP,PT,INVSIG);
gr1->SetLineColor(38);
gr1->SetMarkerStyle(21);
gr1->SetMarkerSize(1.1);
gr1->Draw("LP");
//
// Cross-section of direct photon production in pp collisions
// at 200 GeV vs Pt
//
energ = 200;
dens = 2.25;
tgrad = 90.;
ptmin = 4.;
ptmax = 64.;
delp = 6.;
hz_calc(energ, dens, tgrad, ptmin, ptmax, delp);
TGraph *gr2 = new TGraph(NLOOP,PT,INVSIG);
gr2->SetLineColor(38);
gr2->SetMarkerStyle(29);
gr2->SetMarkerSize(1.5);
gr2->Draw("LP");
//
// Cross-section of direct photon production in pp collisions
// at 500 GeV vs Pt
//
energ = 500;
dens = 2.73;
tgrad = 90.;
ptmin = 4.;
ptmax = 104.;
delp = 10.;
hz_calc(energ, dens, tgrad, ptmin, ptmax, delp);
TGraph *gr3 = new TGraph(NLOOP,PT,INVSIG);
gr3->SetLineColor(38);
gr3->SetMarkerColor(6);
gr3->SetMarkerStyle(8);
gr3->SetMarkerSize(1.1);
gr3->Draw("LP");
Float_t *dum = 0;
TGraph *graph = new TGraph(1,dum,dum);
graph->SetMarkerStyle(21);
graph->SetMarkerSize(1.1);
graph->SetPoint(0,1.7,1.e-16);
graph->Draw("LP");
graph = new TGraph(1,dum,dum);
graph->SetMarkerStyle(29);
graph->SetMarkerSize(1.5);
graph->SetPoint(0,1.7,2.e-17);
graph->Draw("LP");
graph = new TGraph(1,dum,dum);
graph->SetMarkerColor(6);
graph->SetMarkerStyle(8);
graph->SetMarkerSize(1.1);
graph->SetPoint(0,1.7,4.e-18);
graph->Draw("LP");
pad2->cd();
pad2->Range(-0.43642,-23.75,3.92778,-6.25);
pad2->SetLogx();
pad2->SetLogy();
pad2->DrawFrame(1,1e-22,3100,1e-8);
pad2->GetFrame()->SetFillColor(19);
TGraph *gr = new TGraph(NLOOP,Z,HZ);
gr->SetTitle("HZ vs Z");
gr->SetFillColor(19);
gr->SetLineColor(9);
gr->SetMarkerColor(50);
gr->SetMarkerStyle(29);
gr->SetMarkerSize(1.5);
gr->Draw("LP");
t = new TLatex();
t->SetNDC();
t->SetTextFont(62);
t->SetTextColor(36);
t->SetTextSize(0.08);
t->SetTextAlign(12);
t->DrawLatex(0.6,0.85,"p - p");
t->SetTextSize(0.05);
t->DrawLatex(0.6,0.79,"Direct #gamma");
t->DrawLatex(0.6,0.75,"#theta = 90^{o}");
t->DrawLatex(0.70,0.55,"H(z)");
t->DrawLatex(0.68,0.50,"(barn)");
t->SetTextSize(0.045);
t->SetTextColor(46);
t->DrawLatex(0.20,0.30,"#sqrt{s}, GeV");
t->DrawLatex(0.22,0.26,"63");
t->DrawLatex(0.22,0.22,"200");
t->DrawLatex(0.22,0.18,"500");
t->SetTextSize(0.05);
t->SetTextColor(1);
t->DrawLatex(0.88,0.06,"z");
c1->Modified();
c1->Update();
}
void hz_calc(Float_t ENERG, Float_t DENS, Float_t TGRAD, Float_t PTMIN,
Float_t PTMAX, Float_t DELP)
{
Float_t GM1 = 0.00001;
Float_t GM2 = 0.00001;
Float_t A1 = 1.;
Float_t A2 = 1.;
Float_t ALX = 2.;
Float_t BETA = 1.;
Float_t KF1 = 8.E-7;
Float_t KF2 = 5.215;
Float_t MN = 0.9383;
Float_t DEGRAD=0.01745329;
Float_t EB1, EB2, PB1, PB2, MB1, MB2, M1, M2;
Float_t DNDETA;
Float_t P1P2, P1P3, P2P3;
Float_t Y1, Y2, S, SMIN, SX1, SX2, SX1X2, DELM;
Float_t Y1X1, Y1X2, Y2X1, Y2X2, Y2X1X2, Y1X1X2;
Float_t KX1, KX2, ZX1, ZX2;
Float_t H1;
Float_t PTOT, THET, ETOT, X1, X2;
DNDETA= DENS;
MB1 = MN*A1;
MB2 = MN*A2;
EB1 = ENERG/2.*A1;
EB2 = ENERG/2.*A2;
M1 = GM1;
M2 = GM2;
THET = TGRAD*DEGRAD;
NLOOP = (PTMAX-PTMIN)/DELP;
for (I=0; I<NLOOP;I++) {
PT[I]=PTMIN+I*DELP;
PTOT = PT[I]/sin(THET);
ETOT = sqrt(M1*M1 + PTOT*PTOT);
PB1 = sqrt(EB1*EB1 - MB1*MB1);
PB2 = sqrt(EB2*EB2 - MB2*MB2);
P2P3 = EB2*ETOT+PB2*PTOT*cos(THET);
P1P2 = EB2*EB1+PB2*PB1;
P1P3 = EB1*ETOT-PB1*PTOT*cos(THET);
X1 = P2P3/P1P2;
X2 = P1P3/P1P2;
Y1 = X1+sqrt(X1*X2*(1.-X1)/(1.-X2));
Y2 = X2+sqrt(X1*X2*(1.-X2)/(1.-X1));
S = (MB1*MB1)+2.*P1P2+(MB2*MB2);
SMIN = 4.*((MB1*MB1)*(X1*X1) +2.*X1*X2*P1P2+(MB2*MB2)*(X2*X2));
SX1 = 4.*( 2*(MB1*MB1)*X1+2*X2*P1P2);
SX2 = 4.*( 2*(MB2*MB2)*X2+2*X1*P1P2);
SX1X2= 4.*(2*P1P2);
DELM = pow((1.-Y1)*(1.-Y2),ALX);
Z[I] = sqrt(SMIN)/DELM/pow(DNDETA,BETA);
Y1X1 = 1. +X2*(1-2.*X1)/(2.*(Y1-X1)*(1.-X2));
Y1X2 = X1*(1-X1)/(2.*(Y1-X1)*(1.-X2)*(1.-X2));
Y2X1 = X2*(1-X2)/(2.*(Y2-X2)*(1.-X1)*(1.-X1));
Y2X2 = 1. +X1*(1-2.*X2)/(2.*(Y2-X2)*(1.-X1));
Y2X1X2= Y2X1*( (1.-2.*X2)/(X2*(1-X2)) -( Y2X2-1.)/(Y2-X2));
Y1X1X2= Y1X2*( (1.-2.*X1)/(X1*(1-X1)) -( Y1X1-1.)/(Y1-X1));
KX1=-DELM*(Y1X1*ALX/(1.-Y1) + Y2X1*ALX/(1.-Y2));
KX2=-DELM*(Y2X2*ALX/(1.-Y2) + Y1X2*ALX/(1.-Y1));
ZX1=Z[I]*(SX1/(2.*SMIN)-KX1/DELM);
ZX2=Z[I]*(SX2/(2.*SMIN)-KX2/DELM);
H1=ZX1*ZX2;
HZ[I]=KF1/pow(Z[I],KF2);
INVSIG[I]=(HZ[I]*H1*16.)/S;
}
}
Authors
Michael Tokarev and Elena Potrebenikova (JINR Dubna)

Definition in file zdemo.C.