Logo ROOT   6.12/07
Reference Guide
graph2dfit.C File Reference

Detailed Description

View in nbviewer Open in SWAN Fitting a TGraph2D

pict1_graph2dfit.C.png
Processing /mnt/build/workspace/root-makedoc-v612/rootspi/rdoc/src/v6-12-00-patches/tutorials/fit/graph2dfit.C...
****************************************
Minimizer is Minuit / Migrad
Chi2 = 4.25425e+06
NDf = 398
Edm = 1.32198e-12
NCalls = 55
p0 = 0.574556 +/- 0.109982
p1 = 1.72367 +/- 0.329947
(TCanvas *) 0x1406d50
#include <TMath.h>
#include <TGraph2D.h>
#include <TRandom.h>
#include <TStyle.h>
#include <TCanvas.h>
#include <TF2.h>
#include <TH1.h>
TCanvas* graph2dfit()
{
TCanvas *c = new TCanvas("c","Graph2D example",0,0,600,800);
c->Divide(2,3);
Double_t rnd, x, y, z;
Double_t e = 0.3;
Int_t nd = 400;
Int_t np = 10000;
Double_t fl = 6;
TF2 *f2 = new TF2("f2","1000*(([0]*sin(x)/x)*([1]*sin(y)/y))+200",
-fl,fl,-fl,fl);
f2->SetParameters(1,1);
TGraph2D *dt = new TGraph2D();
// Fill the 2D graph
Double_t zmax = 0;
for (Int_t N=0; N<nd; N++) {
f2->GetRandom2(x,y);
// Generate a random number in [-e,e]
rnd = 2*r.Rndm()*e-e;
z = f2->Eval(x,y)*(1+rnd);
if (z>zmax) zmax = z;
dt->SetPoint(N,x,y,z);
}
Double_t hr = 350;
TH1D *h1 = new TH1D("h1",
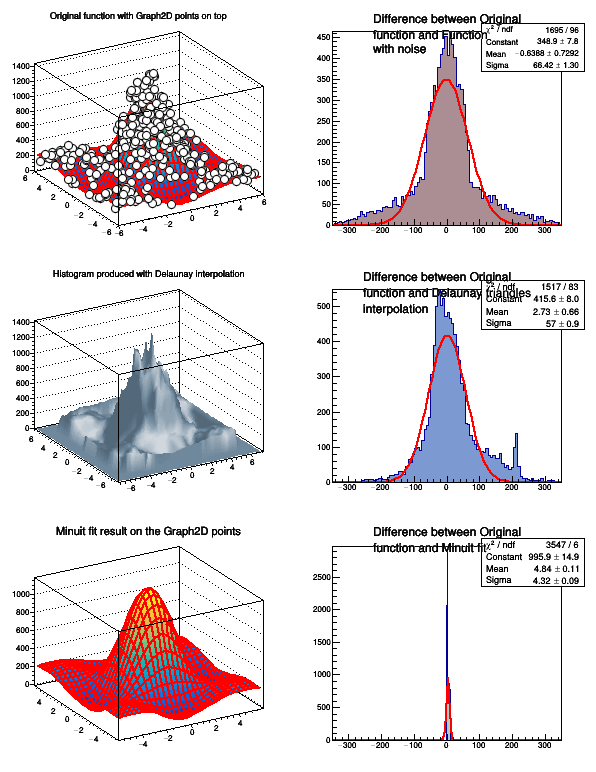
"#splitline{Difference between Original}{#splitline{function and Function}{with noise}}",
100, -hr, hr);
TH1D *h2 = new TH1D("h2",
"#splitline{Difference between Original}{#splitline{function and Delaunay triangles}{interpolation}}",
100, -hr, hr);
TH1D *h3 = new TH1D("h3",
"#splitline{Difference between Original}{function and Minuit fit}",
500, -hr, hr);
f2->SetParameters(0.5,1.5);
dt->Fit(f2);
TF2 *fit2 = (TF2*)dt->FindObject("f2");
f2->SetParameters(1,1);
for (Int_t N=0; N<np; N++) {
f2->GetRandom2(x,y);
// Generate a random number in [-e,e]
rnd = 2*r.Rndm()*e-e;
z = f2->Eval(x,y)*(1+rnd);
h1->Fill(f2->Eval(x,y)-z);
z = dt->Interpolate(x,y);
h2->Fill(f2->Eval(x,y)-z);
z = fit2->Eval(x,y);
h3->Fill(f2->Eval(x,y)-z);
}
c->cd(1);
f2->SetTitle("Original function with Graph2D points on top");
f2->SetMaximum(zmax);
f2->Draw("surf1");
dt->Draw("same p0");
c->cd(3);
dt->SetMargin(0.1);
dt->SetFillColor(36);
dt->SetTitle("Histogram produced with Delaunay interpolation");
dt->Draw("surf4");
c->cd(5);
fit2->SetTitle("Minuit fit result on the Graph2D points");
fit2->Draw("surf1");
h1->SetFillColor(47);
h2->SetFillColor(38);
h3->SetFillColor(29);
c->cd(2); h1->Fit("gaus","Q") ; h1->Draw();
c->cd(4); h2->Fit("gaus","Q") ; h2->Draw();
c->cd(6); h3->Fit("gaus","Q") ; h3->Draw();
c->cd();
return c;
}
Author
Olivier Couet

Definition in file graph2dfit.C.