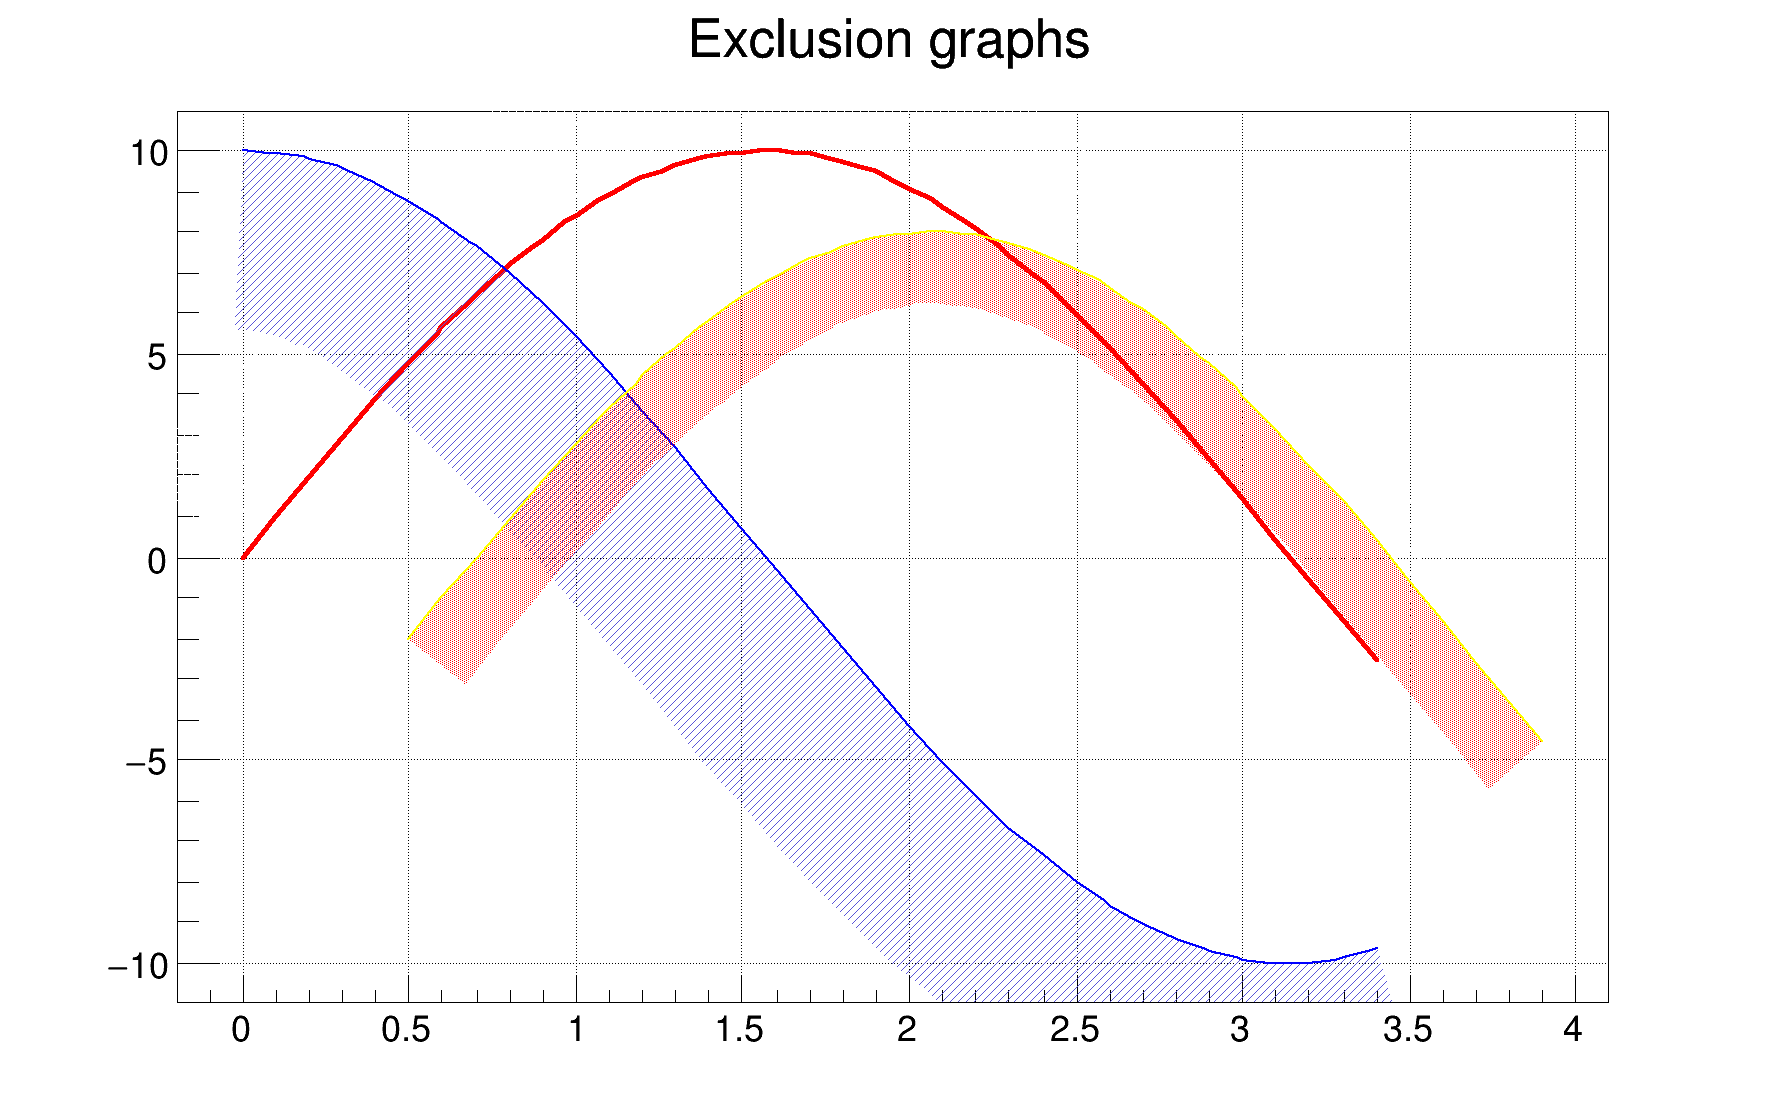
 Draw three graphs with an exclusion zone.
TCanvas *c1 =
new TCanvas(
"c1",
"Exclusion graphs examples",200,10,600,400);
Double_t xvalues1[
n], xvalues2[
n], xvalues3[
n], yvalues1[
n], yvalues2[
n], yvalues3[
n];
xvalues1[i] = i*0.1;
xvalues2[i] = xvalues1[i];
xvalues3[i] = xvalues1[i]+.5;
yvalues1[i] = 10*
sin(xvalues1[i]);
yvalues2[i] = 10*
cos(xvalues1[i]);
yvalues3[i] = 10*
sin(xvalues1[i])-2;
}
}
- Author
- Olivier Couet
Definition in file exclusiongraph.C.


 Draw three graphs with an exclusion zone.