Loading [MathJax]/extensions/tex2jax.js
Logo ROOT   6.14/05
Reference Guide
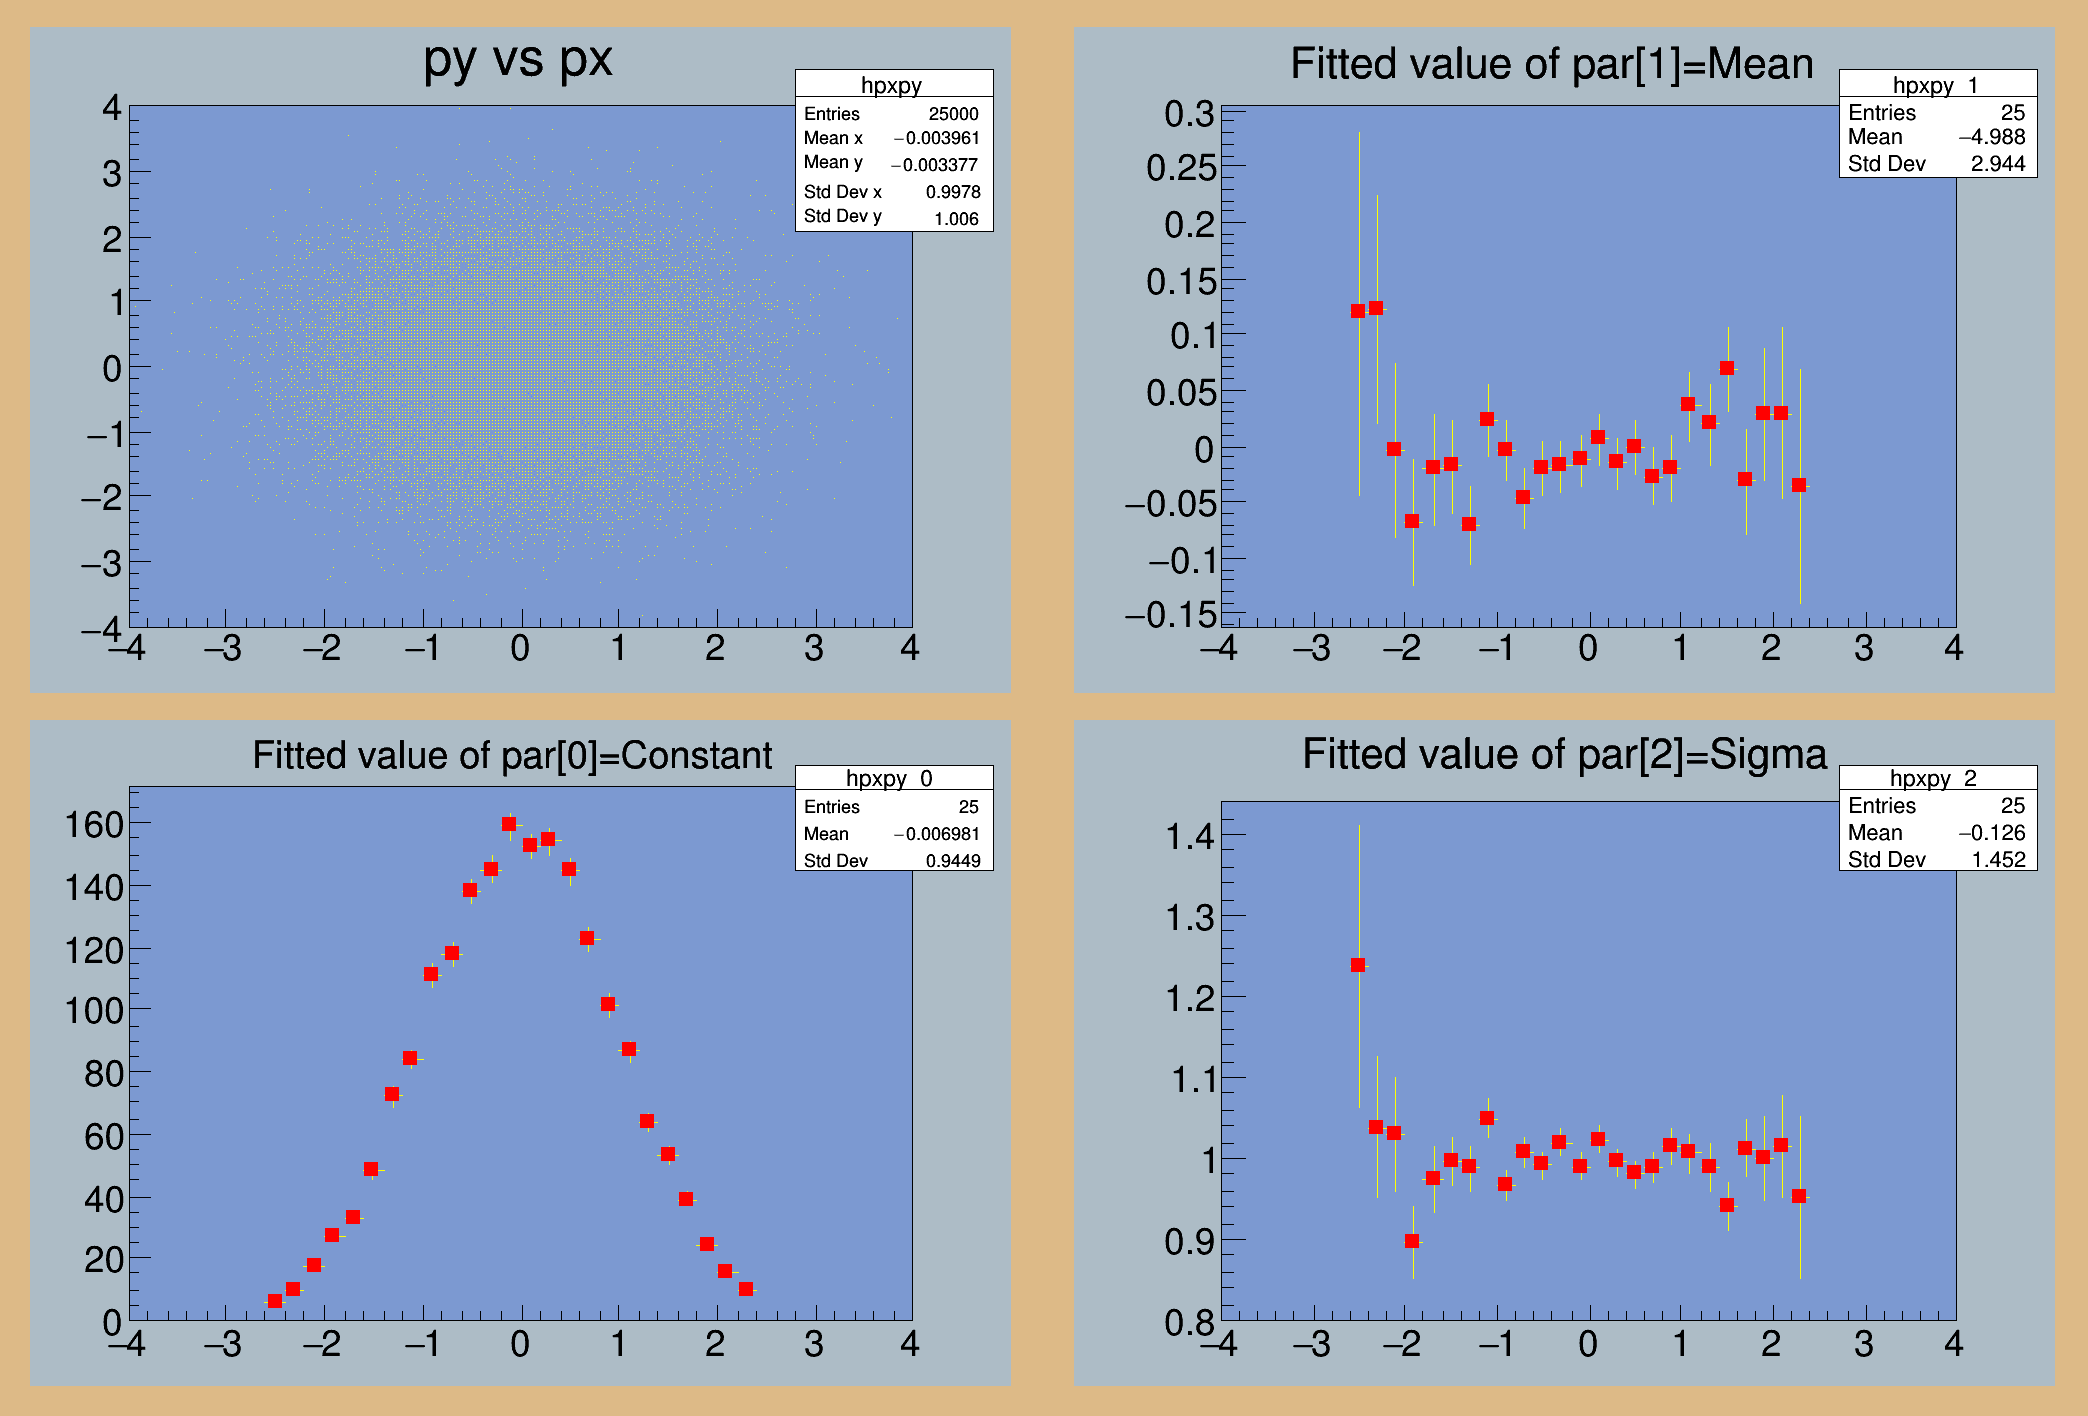
All Classes Namespaces Files Functions Variables Typedefs Enumerations Enumerator Properties Friends Macros Modules Pages
fitslicesy.C File Reference

Detailed Description

View in nbviewer Open in SWAN Illustrates how to use the TH1::FitSlicesY function It uses the TH2F histogram generated in macro hsimple.C It invokes FitSlicesY and draw the fitted "mean" and "sigma" in 2 sepate pads.

This macro shows also how to annotate a picture, change some pad parameters.

pict1_fitslicesy.C.png
Processing /mnt/build/workspace/root-makedoc-v614/rootspi/rdoc/src/v6-14-00-patches/tutorials/fit/fitslicesy.C...
void fitslicesy() {
// Change some default parameters in the current style
gStyle->SetLabelSize(0.06,"x");
gStyle->SetLabelSize(0.06,"y");
// Connect the input file and get the 2-d histogram in memory
TString dir = gROOT->GetTutorialDir();
dir.Append("/hsimple.C");
dir.ReplaceAll("/./","/");
if (!gInterpreter->IsLoaded(dir.Data())) gInterpreter->LoadMacro(dir.Data());
TFile *hsimpleFile = (TFile*)gROOT->ProcessLineFast("hsimple(1)");
if (!hsimpleFile) return;
TH2F *hpxpy = (TH2F*)hsimpleFile->Get("hpxpy");
// Create a canvas and divide it
TCanvas *c1 = new TCanvas("c1","c1",700,500);
c1->SetFillColor(42);
c1->Divide(2,1);
TPad *leftPad = (TPad*)c1->cd(1);;
leftPad->Divide(1,2);
// Draw 2-d original histogram
leftPad->cd(1);
gPad->SetTopMargin(0.12);
gPad->SetFillColor(33);
hpxpy->Draw();
hpxpy->GetXaxis()->SetLabelSize(0.06);
hpxpy->GetYaxis()->SetLabelSize(0.06);
hpxpy->SetMarkerColor(kYellow);
// Fit slices projected along Y fron bins in X [7,32] with more than 20 bins in Y filled
hpxpy->FitSlicesY(0,7,32,20);
// Show fitted "mean" for each slice
leftPad->cd(2);
gPad->SetFillColor(33);
TH2F *hpxpy_0 = (TH2F*)hsimpleFile->Get("hpxpy_0");
hpxpy_0->Draw();
TPad *rightPad = (TPad*)c1->cd(2);
rightPad->Divide(1,2);
rightPad->cd(1);
gPad->SetTopMargin(0.12);
gPad->SetLeftMargin(0.15);
gPad->SetFillColor(33);
TH2F *hpxpy_1 = (TH2F*)hsimpleFile->Get("hpxpy_1");
hpxpy_1->Draw();
// Show fitted "sigma" for each slice
rightPad->cd(2);
gPad->SetTopMargin(0.12);
gPad->SetLeftMargin(0.15);
gPad->SetFillColor(33);
TH2F *hpxpy_2 = (TH2F*)hsimpleFile->Get("hpxpy_2");
hpxpy_2->SetMinimum(0.8);
hpxpy_2->Draw();
//attributes
hpxpy_0->SetLineColor(5);
hpxpy_1->SetLineColor(5);
hpxpy_2->SetLineColor(5);
hpxpy_0->SetMarkerColor(2);
hpxpy_1->SetMarkerColor(2);
hpxpy_2->SetMarkerColor(2);
hpxpy_0->SetMarkerStyle(21);
hpxpy_1->SetMarkerStyle(21);
hpxpy_2->SetMarkerStyle(21);
hpxpy_0->SetMarkerSize(0.6);
hpxpy_1->SetMarkerSize(0.6);
hpxpy_2->SetMarkerSize(0.6);
}
Author
Rene Brun

Definition in file fitslicesy.C.