 |
ROOT 6.14/05 Reference Guide |
| |
ROOT 6.14/05 Reference Guide |

![]() Example which shows how you can get the graph of the lower plot and set the y axis range for it.
Example which shows how you can get the graph of the lower plot and set the y axis range for it.
Since the lower plot is not created until TRatioPlot::Draw is called, you can only use the method afterwards.
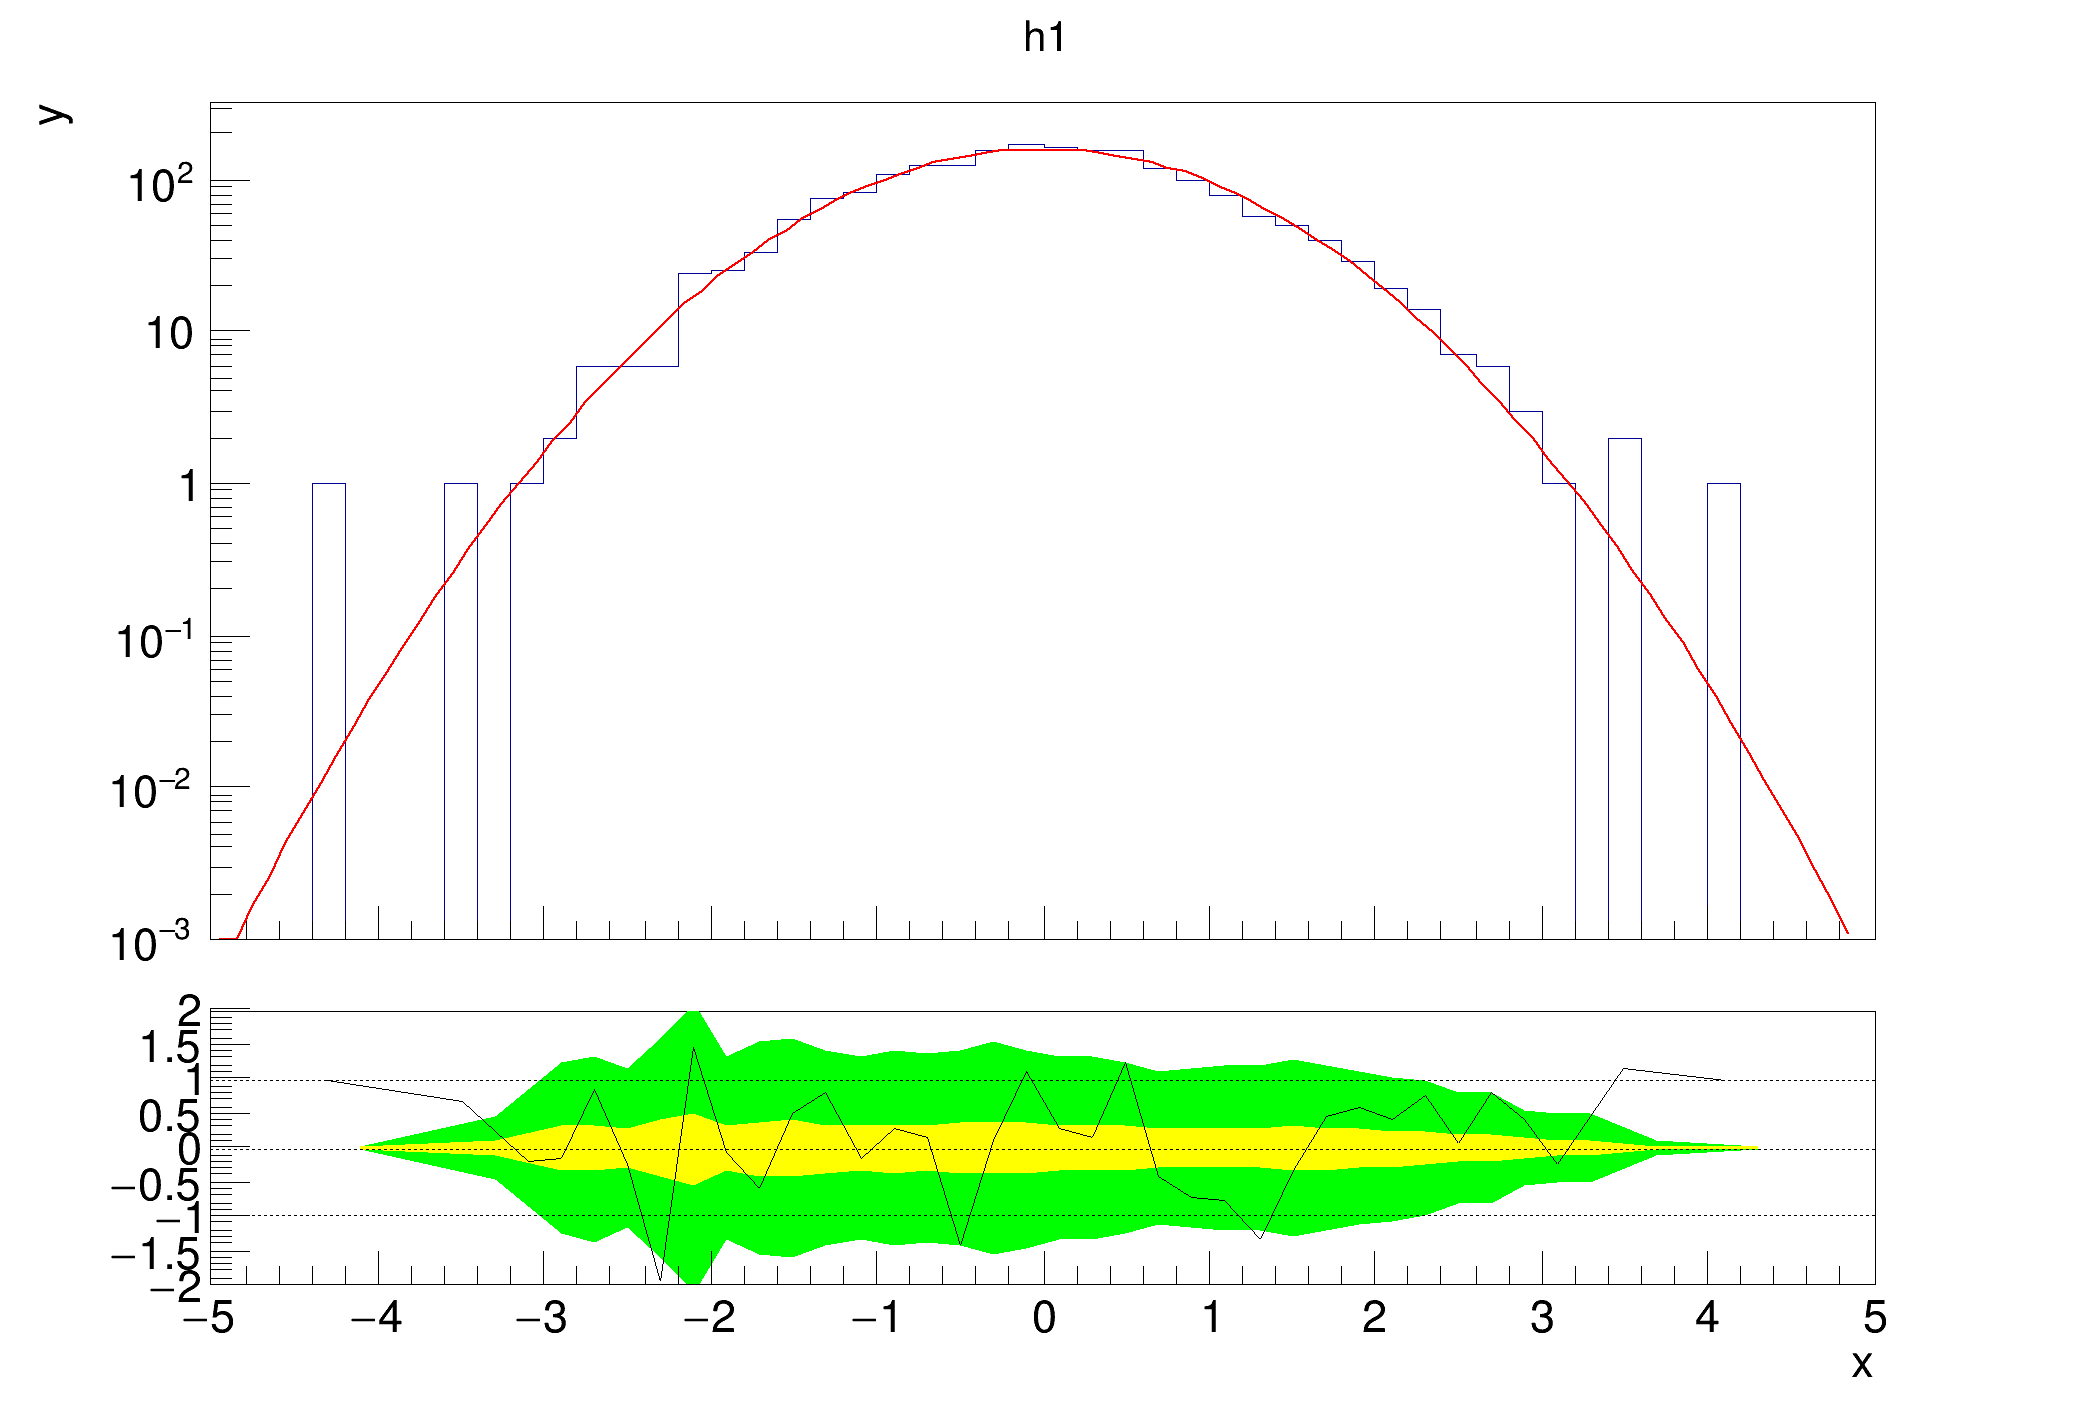
Definition in file ratioplot3.C.
 ROOT 6.14/05 - Reference Guide Generated on Fri Nov 2 2018 10:58:30 (GVA Time) using Doxygen 1.8.13.