 |
ROOT 6.14/05 Reference Guide |
| |
ROOT 6.14/05 Reference Guide |

![]() Example that shows how you can set the colors of the confidence interval bands by using the method
Example that shows how you can set the colors of the confidence interval bands by using the method TRatioPlot::SetConfidenceIntervalColors.
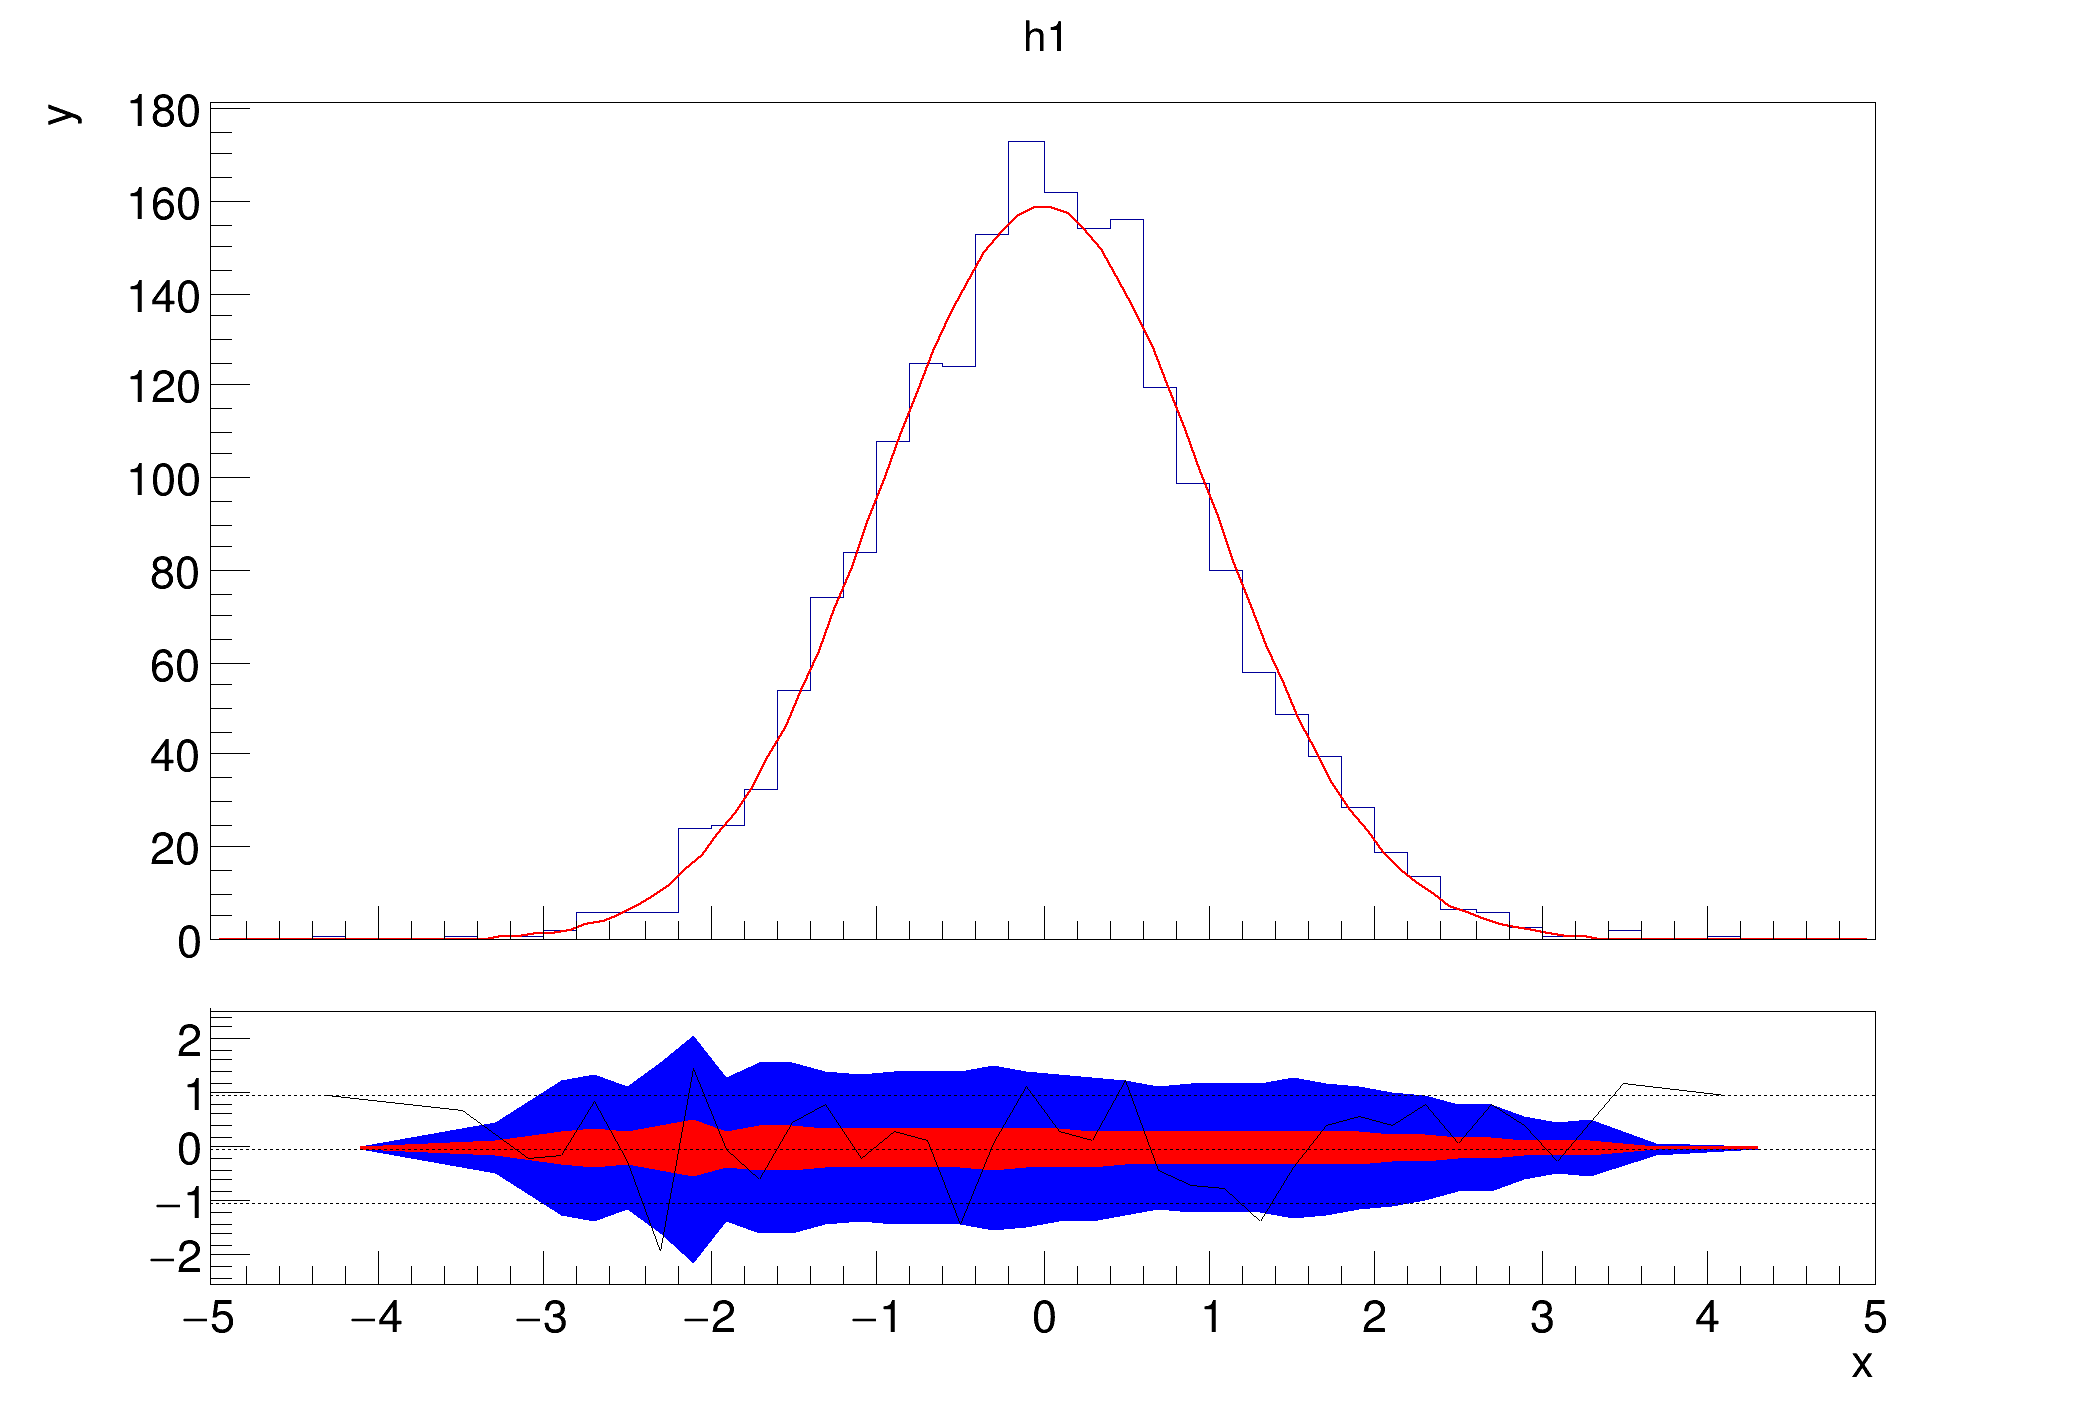
Definition in file ratioplot5.C.
 ROOT 6.14/05 - Reference Guide Generated on Fri Nov 2 2018 10:58:30 (GVA Time) using Doxygen 1.8.13.