 'MULTIDIMENSIONAL MODELS' RooFit tutorial macro #310
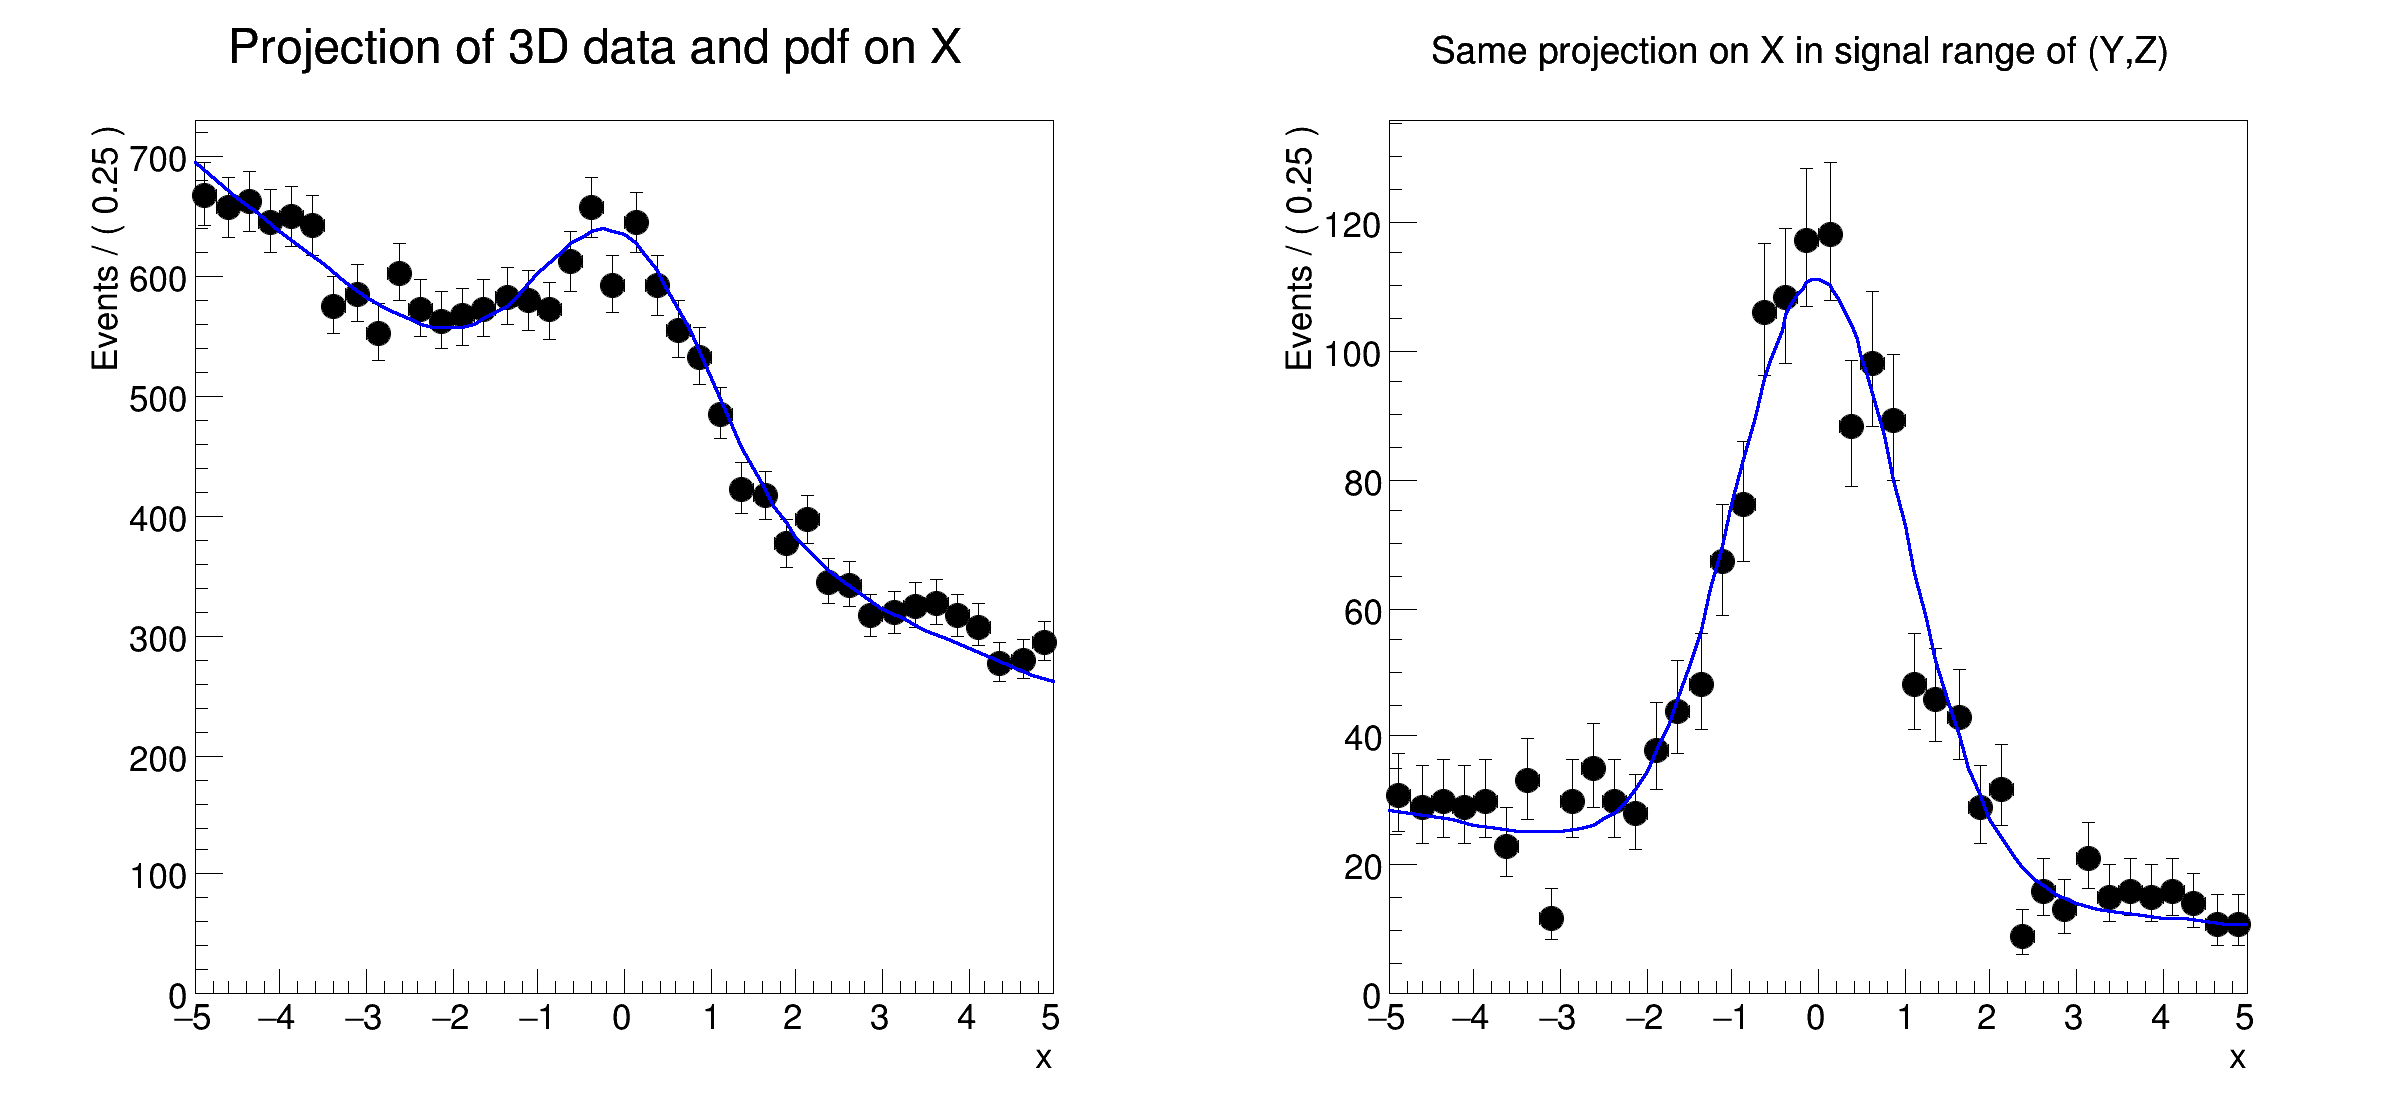
Projecting p.d.f and data ranges in continuous observables
Processing /mnt/build/workspace/root-makedoc-v614/rootspi/rdoc/src/v6-14-00-patches/tutorials/roofit/rf311_rangeplot.C...
�[1mRooFit v3.60 -- Developed by Wouter Verkerke and David Kirkby�[0m
Copyright (C) 2000-2013 NIKHEF, University of California & Stanford University
All rights reserved, please read http://roofit.sourceforge.net/license.txt
[#1] INFO:Plotting -- RooAbsReal::plotOn(model) plot on x integrates over variables (y,z)
[#1] INFO:Eval -- RooRealVar::setRange(y) new range named 'sigRegion' created with bounds [-1,1]
[#1] INFO:Eval -- RooRealVar::setRange(z) new range named 'sigRegion' created with bounds [-1,1]
[#1] INFO:Plotting -- RooTreeData::plotOn: plotting 1692 events out of 20000 total events
[#1] INFO:Plotting -- RooAbsReal::plotOn(model) plot on x integrates over variables (y,z) in range sigRegion
void rf311_rangeplot()
{
RooRealVar fsig(
"fsig",
"signal fraction",0.1,0.,1.) ;
RooPlot* frame = x.frame(
Title(
"Projection of 3D data and pdf on X"),
Bins(40)) ;
model.plotOn(frame) ;
y.setRange("sigRegion",-1,1) ;
z.setRange("sigRegion",-1,1) ;
RooPlot* frame2 = x.frame(
Title(
"Same projection on X in signal range of (Y,Z)"),
Bins(40)) ;
TCanvas* c =
new TCanvas(
"rf311_rangeplot",
"rf310_rangeplot",800,400) ;
}
- Author
- 07/2008 - Wouter Verkerke
Definition in file rf311_rangeplot.C.


 'MULTIDIMENSIONAL MODELS' RooFit tutorial macro #310