
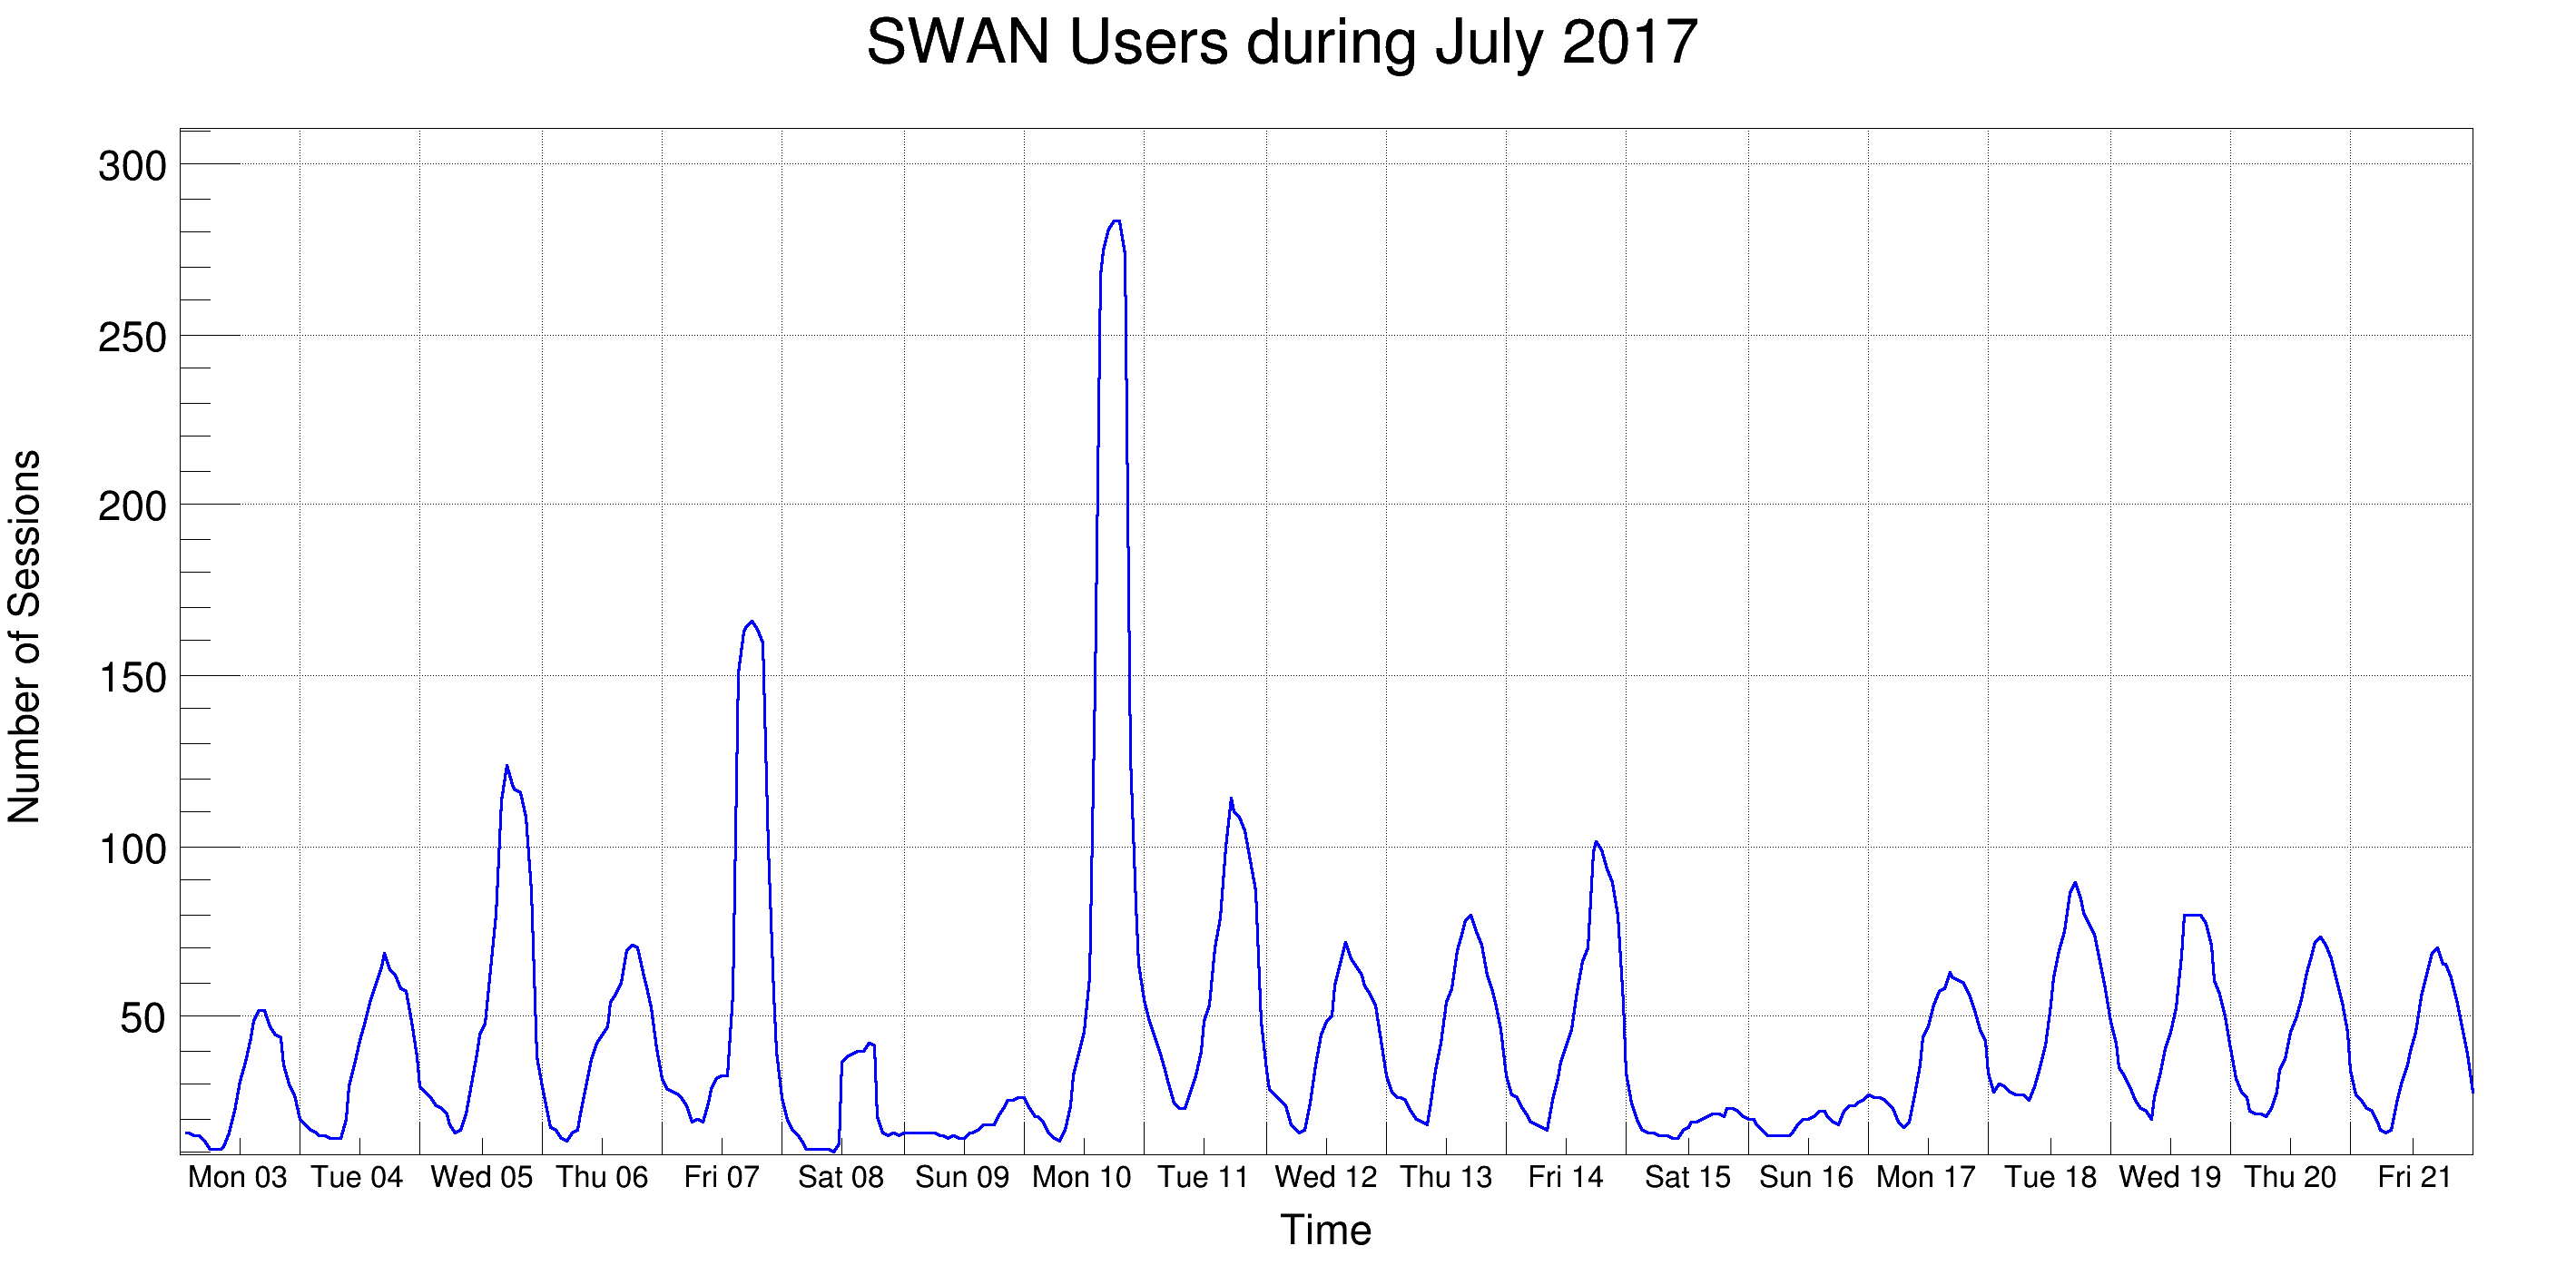
 This macro illustrates the use of the time axis on a TGraph with data read from a text file containing the SWAN usage statistics during July 2017.
We exploit the TDataFrame for reading from the file
void timeSeriesFromCSV_TDF()
{
auto d = tdf.Define("TimeStamp", "auto s = string(Col0) + ' ' + Col1; return (float) TDatime(s.c_str()).Convert();")
.Define("Value", "(float)Col2");
auto timeStamps = d.Take<float>("TimeStamp");
auto values = d.Take<float>("Value");
auto g =
new TGraph(values->size(), timeStamps->data(), values->data());
g->
SetTitle(
"SWAN Users during July 2017;Time;Number of Sessions");
auto c =
new TCanvas(
"c",
"c", 950, 500);
g->SetLineWidth(3);
g->SetLineColor(kBlue);
g->Draw("al");
g->GetYaxis()->CenterTitle();
auto xaxis = g->GetXaxis();
xaxis->SetTimeDisplay(1);
xaxis->CenterTitle();
xaxis->SetTimeFormat("%a %d");
xaxis->SetTimeOffset(0);
xaxis->SetNdivisions(-219);
xaxis->SetLimits(
TDatime(2017, 7, 3, 0, 0, 0).Convert(),
TDatime(2017, 7, 22, 0, 0, 0).Convert());
xaxis->SetLabelSize(0.025);
xaxis->CenterLabels();
}
- Authors
- Danilo Piparo, Olivier Couet
Definition in file timeSeriesFromCSV_TDF.C.

 ROOT 6.14/05 - Reference Guide Generated on Fri Nov 2 2018 10:58:20 (GVA Time) using Doxygen 1.8.13.