Logo ROOT   6.14/05
Reference Guide
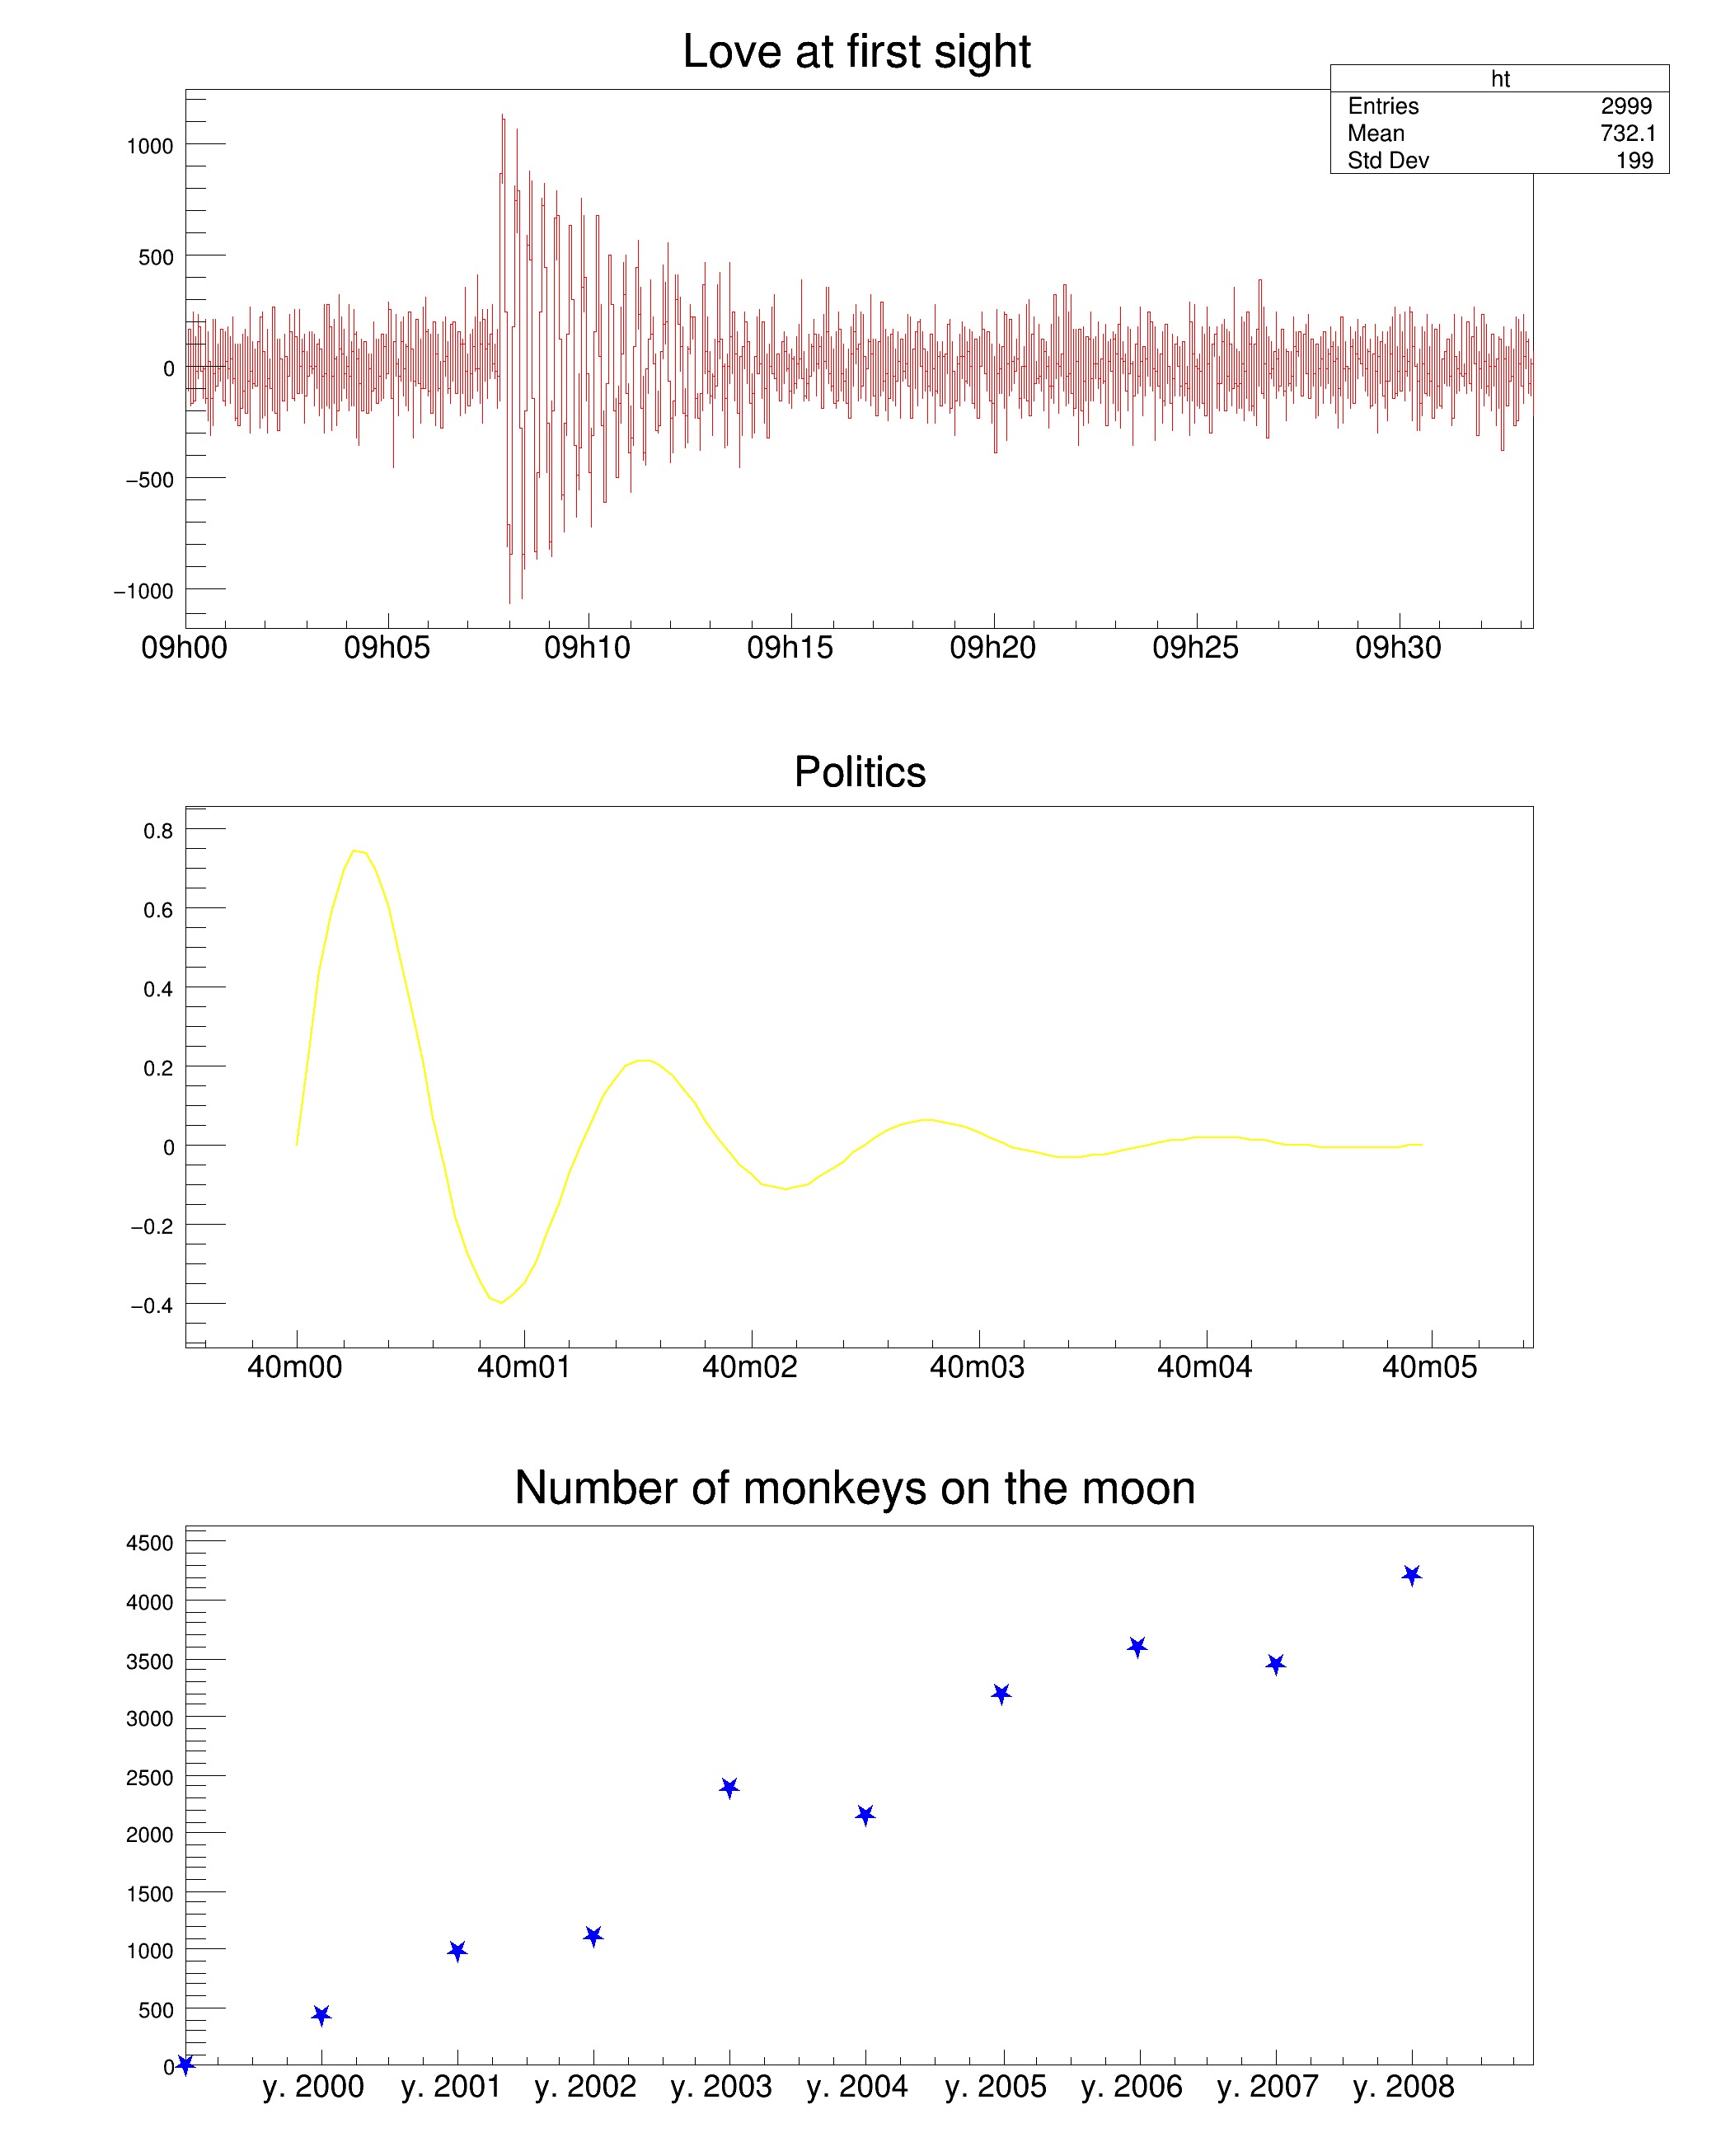
timeonaxis.C File Reference

Detailed Description

View in nbviewer Open in SWAN This macro illustrates the use of the time mode on the axis with different time intervals and time formats.

Through all this script, the time is expressed in UTC. some information about this format (and others like GPS) may be found at http://tycho.usno.navy.mil/systime.html or http://www.topology.org/sci/time.html

The start time is : almost NOW (the time at which the script is executed) actually, the nearest preceding hour beginning. The time is in general expressed in UTC time with the C time() function This will obviously most of the time not be the time displayed on your watch since it is universal time. See the C time functions for converting this time into more useful structures.

pict1_timeonaxis.C.png
#include <time.h>
TCanvas *timeonaxis()
{
time_t script_time;
script_time = time(0);
script_time = 3600*(int)(script_time/3600);
// The time offset is the one that will be used by all graphs.
// If one changes it, it will be changed even on the graphs already defined
gStyle->SetTimeOffset(script_time);
TCanvas *ct = new TCanvas("ct","Time on axis",10,10,700,900);
ct->Divide(1,3);
int i;
//### Build a signal : noisy damped sine
// Time interval : 30 minutes
gStyle->SetTitleH(0.08);
float noise;
TH1F *ht = new TH1F("ht","Love at first sight",3000,0.,2000.);
for (i=1;i<3000;i++) {
noise = gRandom->Gaus(0,120);
if (i>700) {
noise += 1000*sin((i-700)*6.28/30)*exp((double)(700-i)/300);
}
ht->SetBinContent(i,noise);
}
ct->cd(1);
ht->SetLineColor(2);
ht->GetXaxis()->SetLabelSize(0.05);
ht->Draw();
// Sets time on the X axis
// The time used is the one set as time offset added to the value
// of the axis. This is converted into day/month/year hour:min:sec and
// a reasonable tick interval value is chosen.
//### Build a simple graph beginning at a different time
// Time interval : 5 seconds
float x[100], t[100];
for (i=0;i<100;i++) {
x[i] = sin(i*4*3.1415926/50)*exp(-(double)i/20);
t[i] = 6000+(double)i/20;
}
TGraph *gt = new TGraph(100,t,x);
gt->SetTitle("Politics");
ct->cd(2);
gt->SetLineColor(5);
gt->SetLineWidth(2);
gt->Draw("AL");
gt->GetXaxis()->SetLabelSize(0.05);
// Sets time on the X axis
gPad->Modified();
//### Build a second simple graph for a very long time interval
// Time interval : a few years
float x2[10], t2[10];
for (i=0;i<10;i++) {
x2[i] = gRandom->Gaus(500,100)*i;
t2[i] = i*365*86400;
}
TGraph *gt2 = new TGraph(10,t2,x2);
gt2->SetTitle("Number of monkeys on the moon");
ct->cd(3);
gt2->SetMarkerColor(4);
gt2->SetMarkerStyle(29);
gt2->SetMarkerSize(1.3);
gt2->Draw("AP");
gt2->GetXaxis()->SetLabelSize(0.05);
// Sets time on the X axis
//
// One can choose a different time format than the one chosen by default
// The time format is the same as the one of the C strftime() function
// It's a string containing the following formats :
//
// for date :
// %a abbreviated weekday name
// %b abbreviated month name
// %d day of the month (01-31)
// %m month (01-12)
// %y year without century
// %Y year with century
//
// for time :
// %H hour (24-hour clock)
// %I hour (12-hour clock)
// %p local equivalent of AM or PM
// %M minute (00-59)
// %S seconds (00-61)
// %% %
// The other characters are output as is.
gt2->GetXaxis()->SetTimeFormat("y. %Y %F2000-01-01 00:00:00");
gPad->Modified();
return ct;
}
Author
Damir Buskulic

Definition in file timeonaxis.C.