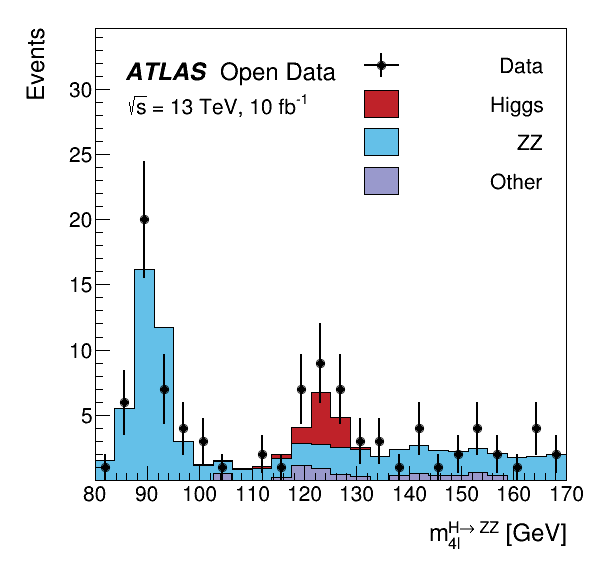
The data was taken with the ATLAS detector during 2016 at a center-of-mass energy of 13 TeV. The decay of the Standard Model Higgs boson to two Z bosons and subsequently to four leptons is called the "golden channel". The selection leads to a narrow invariant mass peak on top a relatively smooth and small background, revealing the Higgs at 125 GeV.
The analysis is translated to a RDataFrame workflow processing about 300 MB of simulated events and data.
import ROOT
import json
import os
path = "root://eospublic.cern.ch//eos/opendata/atlas/OutreachDatasets/2020-01-22"
files = json.load(
open(os.path.join(os.environ[
"ROOTSYS"],
"tutorials/dataframe",
"df106_HiggsToFourLeptons.json")))
processes = files.keys()
df = {}
xsecs = {}
sumws = {}
samples = []
for p in processes:
for d in files[p]:
folder = d[0]
sample = d[1]
xsecs[sample] = d[2]
sumws[sample] = d[3]
samples.append(sample)
df[sample] =
ROOT.RDataFrame(
"mini",
"{}/4lep/{}/{}.4lep.root".format(path, folder, sample))
ROOT.gInterpreter.Declare("""
using VecF_t = const ROOT::RVec<float>&;
using VecI_t = const ROOT::RVec<int>&;
bool GoodElectronsAndMuons(VecI_t type, VecF_t pt, VecF_t eta, VecF_t phi, VecF_t e, VecF_t trackd0pv, VecF_t tracksigd0pv, VecF_t z0)
{
for (size_t i = 0; i < type.size(); i++) {
ROOT::Math::PtEtaPhiEVector p(pt[i] / 1000.0, eta[i], phi[i], e[i] / 1000.0);
if (type[i] == 11) {
if (pt[i] < 7000 || abs(eta[i]) > 2.47 || abs(trackd0pv[i] / tracksigd0pv[i]) > 5 || abs(z0[i] *
sin(p.Theta())) > 0.5)
return false;
} else {
if (abs(trackd0pv[i] / tracksigd0pv[i]) > 5 || abs(z0[i] *
sin(p.Theta())) > 0.5)
return false;
}
}
return true;
}
""")
for s in samples:
df[s] = df[s].
Filter(
"trigE || trigM")
df[s] = df[s].Define("good_lep", "abs(lep_eta) < 2.5 && lep_pt > 5000 && lep_ptcone30 / lep_pt < 0.3 && lep_etcone20 / lep_pt < 0.3")\
.
Filter(
"Sum(good_lep) == 4")\
.
Filter(
"Sum(lep_charge[good_lep]) == 0")\
.Define("goodlep_sumtypes", "Sum(lep_type[good_lep])")\
.
Filter(
"goodlep_sumtypes == 44 || goodlep_sumtypes == 52 || goodlep_sumtypes == 48")
df[s] = df[s].
Filter(
"GoodElectronsAndMuons(lep_type[good_lep], lep_pt[good_lep], lep_eta[good_lep], lep_phi[good_lep], lep_E[good_lep], lep_trackd0pvunbiased[good_lep], lep_tracksigd0pvunbiased[good_lep], lep_z0[good_lep])")
df[s] = df[s].Define("goodlep_pt", "lep_pt[good_lep]")\
.Define("goodlep_eta", "lep_eta[good_lep]")\
.Define("goodlep_phi", "lep_phi[good_lep]")\
.Define("goodlep_E", "lep_E[good_lep]")
df[s] = df[s].
Filter(
"goodlep_pt[0] > 25000 && goodlep_pt[1] > 15000 && goodlep_pt[2] > 10000")
lumi = 10064.0
for s in samples:
if "data" in s:
df[s] = df[s].Define("weight", "1.0")
else:
df[s] = df[s].Define("weight", "scaleFactor_ELE * scaleFactor_MUON * scaleFactor_LepTRIGGER * scaleFactor_PILEUP * mcWeight * {} / {} * {}".format(xsecs[s], sumws[s], lumi))
ROOT.gInterpreter.Declare("""
float ComputeInvariantMass(VecF_t pt, VecF_t eta, VecF_t phi, VecF_t e)
{
ROOT::Math::PtEtaPhiEVector p1(pt[0], eta[0], phi[0], e[0]);
ROOT::Math::PtEtaPhiEVector p2(pt[1], eta[1], phi[1], e[1]);
ROOT::Math::PtEtaPhiEVector p3(pt[2], eta[2], phi[2], e[2]);
ROOT::Math::PtEtaPhiEVector p4(pt[3], eta[3], phi[3], e[3]);
return (p1 + p2 + p3 + p4).M() / 1000;
}
""")
histos = {}
for s in samples:
df[s] = df[s].Define("m4l", "ComputeInvariantMass(goodlep_pt, goodlep_eta, goodlep_phi, goodlep_E)")
def merge_histos(label):
h = None
for i, d in enumerate(files[label]):
t = histos[d[1]].GetValue()
if i == 0: h = t.Clone()
else: h.Add(t)
h.SetNameTitle(label, label)
return h
data = merge_histos("data")
higgs = merge_histos("higgs")
zz = merge_histos("zz")
other = merge_histos("other")
zz.Scale(1.3)
ROOT.gROOT.SetStyle("ATLAS")
c = ROOT.TCanvas("c", "", 600, 600)
pad = ROOT.TPad("upper_pad", "", 0, 0, 1, 1)
pad.SetTickx(False)
pad.SetTicky(False)
pad.Draw()
pad.cd()
stack = ROOT.THStack()
for h, color in zip([other, zz, higgs], [(155, 152, 204), (100, 192, 232), (191, 34, 41)]):
h.SetLineWidth(1)
h.SetLineColor(1)
h.SetFillColor(ROOT.TColor.GetColor(*color))
stack.Add(h)
stack.Draw("HIST")
stack.GetXaxis().SetLabelSize(0.04)
stack.GetXaxis().SetTitleSize(0.045)
stack.GetXaxis().SetTitleOffset(1.3)
stack.GetXaxis().SetTitle("m_{4l}^{H#rightarrow ZZ} [GeV]")
stack.GetYaxis().SetTitle("Events")
stack.GetYaxis().SetLabelSize(0.04)
stack.GetYaxis().SetTitleSize(0.045)
stack.SetMaximum(33)
stack.GetYaxis().ChangeLabel(1, -1, 0)
data.SetMarkerStyle(20)
data.SetMarkerSize(1.2)
data.SetLineWidth(2)
data.SetLineColor(ROOT.kBlack)
data.Draw("E SAME")
legend = ROOT.TLegend(0.60, 0.65, 0.92, 0.92)
legend.SetTextFont(42)
legend.SetFillStyle(0)
legend.SetBorderSize(0)
legend.SetTextSize(0.04)
legend.SetTextAlign(32)
legend.AddEntry(data, "Data" ,"lep")
legend.AddEntry(higgs, "Higgs", "f")
legend.AddEntry(zz, "ZZ", "f")
legend.AddEntry(other, "Other", "f")
legend.Draw("SAME")
text = ROOT.TLatex()
text.SetNDC()
text.SetTextFont(72)
text.SetTextSize(0.045)
text.DrawLatex(0.21, 0.86, "ATLAS")
text.SetTextFont(42)
text.DrawLatex(0.21 + 0.16, 0.86, "Open Data")
text.SetTextSize(0.04)
text.DrawLatex(0.21, 0.80, "#sqrt{s} = 13 TeV, 10 fb^{-1}")
c.SaveAs("HiggsToFourLeptons.pdf")
ROOT's RDataFrame offers a high level interface for analyses of data stored in TTrees,...
RVec< T > Filter(const RVec< T > &v, F &&f)
Create a new collection with the elements passing the filter expressed by the predicate.
A struct which stores the parameters of a TH1D.